Trends to Watch
[ILA – USMX Labor Dispute Update]
- The International Longshoremen’s Association (ILA) and the employer group United States Maritime Alliance (USMX) are locked in another dispute surrounding automation at American ports, with less than a month and a half to go before the January 15, 2025 deadline.
- In a Monday (December 2) Facebook post, ILA Executive VP Dennis Daggett criticized semi-automated rail-mounted gantry cranes (RMGs) for eliminating jobs and posing national security risks.
- In a response released on December 3, the USMX defended automation as essential for port modernization and addressing land constraints.
- No negotiations are currently underway. Follow our live blog for more updates.
[Ocean – TPEB]
- Rates: Floating rates continue to ease for the West Coast, with open space to both the Pacific Southwest and Northwest. Carriers are eyeing a Dec. 15 General Rate Increase (GRI), pending confirmation, based on pre-tariff and pre-Lunar New Year cargo surges.
- Space: East Coast and Gulf services remain tight, with most strings full through mid-December.
- Peak Season Surcharge (PSS): No further PSS reliefs we head into the last month of the year.
[Ocean – FEWB]
- Rates: 1H December GRI was announced at $6,000–6,200/FEU, but settled at $5,300–5,500/FEU. The Shanghai Containerized Freight Index (SCFI) rose by $558/TEU in Week 49, reflecting GRI implementation. Rates are expected to increase slightly with floating rate adjustments before easing in 2H Dec.
- Space: Space was full in 1H Dec due to late November overflow. However, with no strong demand upticks or additional loaders arriving, space in 2H Dec is manageable. Premium options are available for those requiring firm space on earlier estimated times of departure (ETDs) or specific service/transit times.
- Premium options: Occasional equipment shortages persist at main Chinese ports, but remain manageable.
[Ocean – TAWB]
- Space: Vessel capacity remains tight due to blank sailings and high demand from both North and South Europe. Restructuring-related blank sailings are expected to continue until the last week of January in 2025, when the new network launches.
- Extra charges: Some carriers have announced 2025 emission charges, combining the EU Emissions Trading System (EU ETS) and FuelEU Maritime Regulation, with increases of 55-75%.
- Rates: December rates remain stable for most carriers, following November trends for North and South Europe, with slight adjustments in the East Mediterranean, particularly Turkey.
[Air – Global] Mon 18 Nov – Sun 24 Nov 2024 (Week 47):
- Rates at peak levels: Global average rates rose +4% WoW to $3.21, driven by spot rate increases of +12% from North America and +8% from Europe, marking the highest levels in 2024.
- Year-on-year gains: Rates globally are up +10% YoY, with spot rates +22% YoY and Asia Pacific/Middle East rates climbing +10% and +48% YoY, respectively. North America remains below 2023 levels.
- Capacity shifts impacting dynamics: -3% YoY Transatlantic capacity reduction contrasts with +7% YoY growth in Asia-Pacific-North America routes, reflecting increased ecommerce demand.
- Thanksgiving boosts tonnage: North America’s chargeable weight surged +22% YoY, driven by holiday timing (Thanksgiving this year CW48 iso 47), while global tonnages held steady WoW, with only Central and South America growing +3% WoW.
Source: worldacd.com
Please reach out to your account representative for details on any impacts to your shipments.
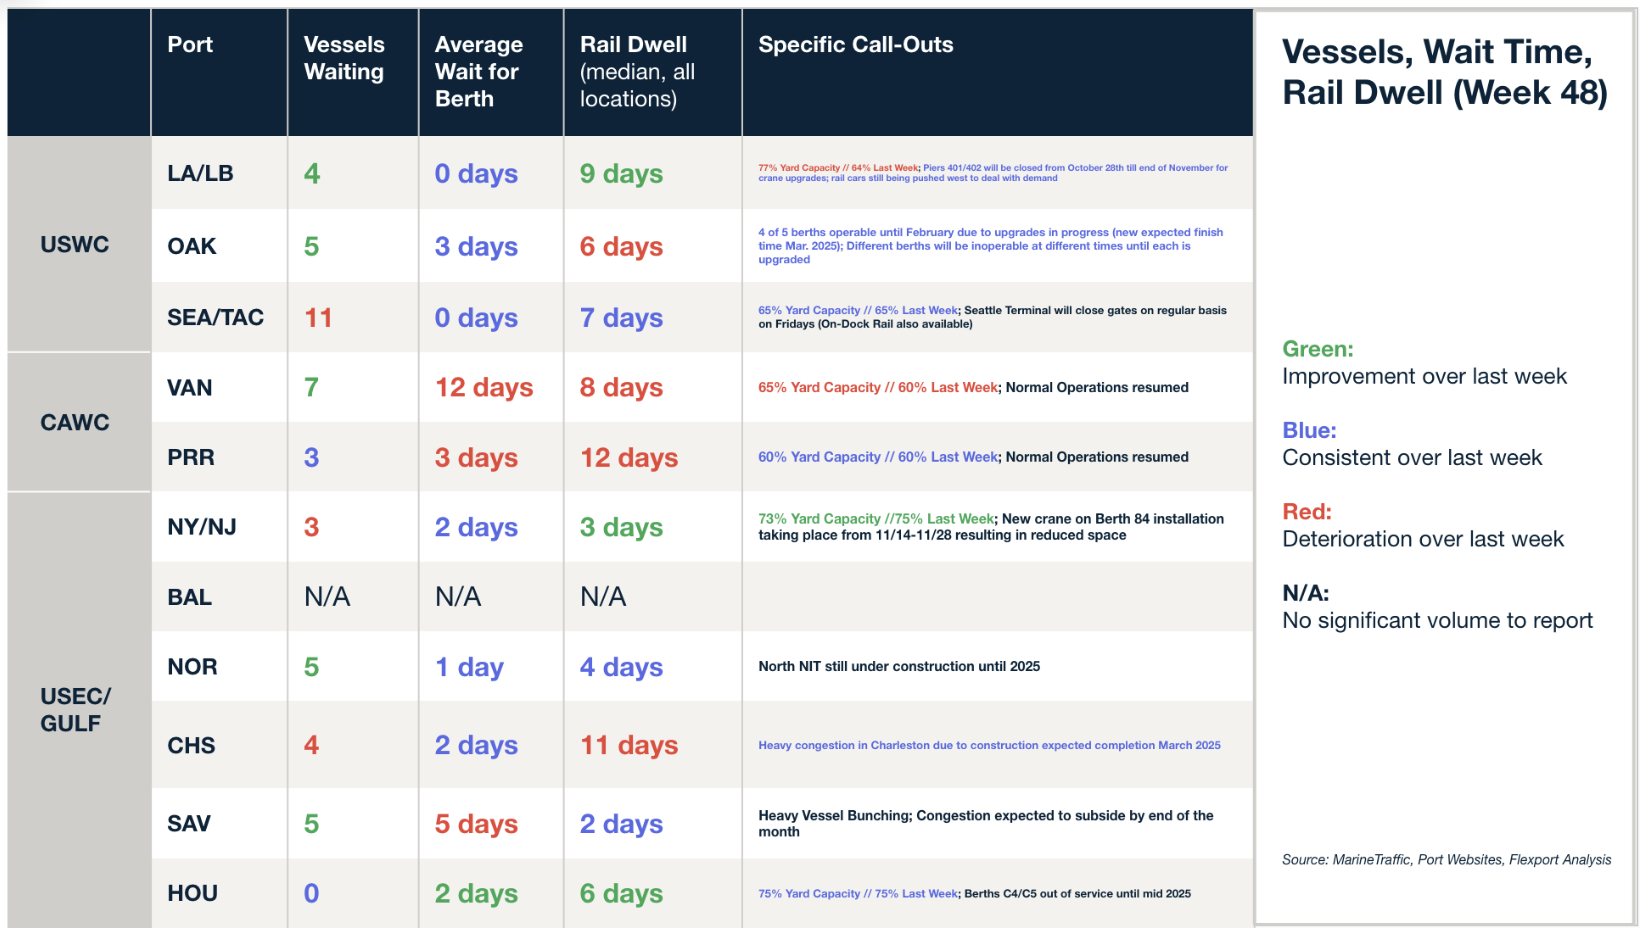
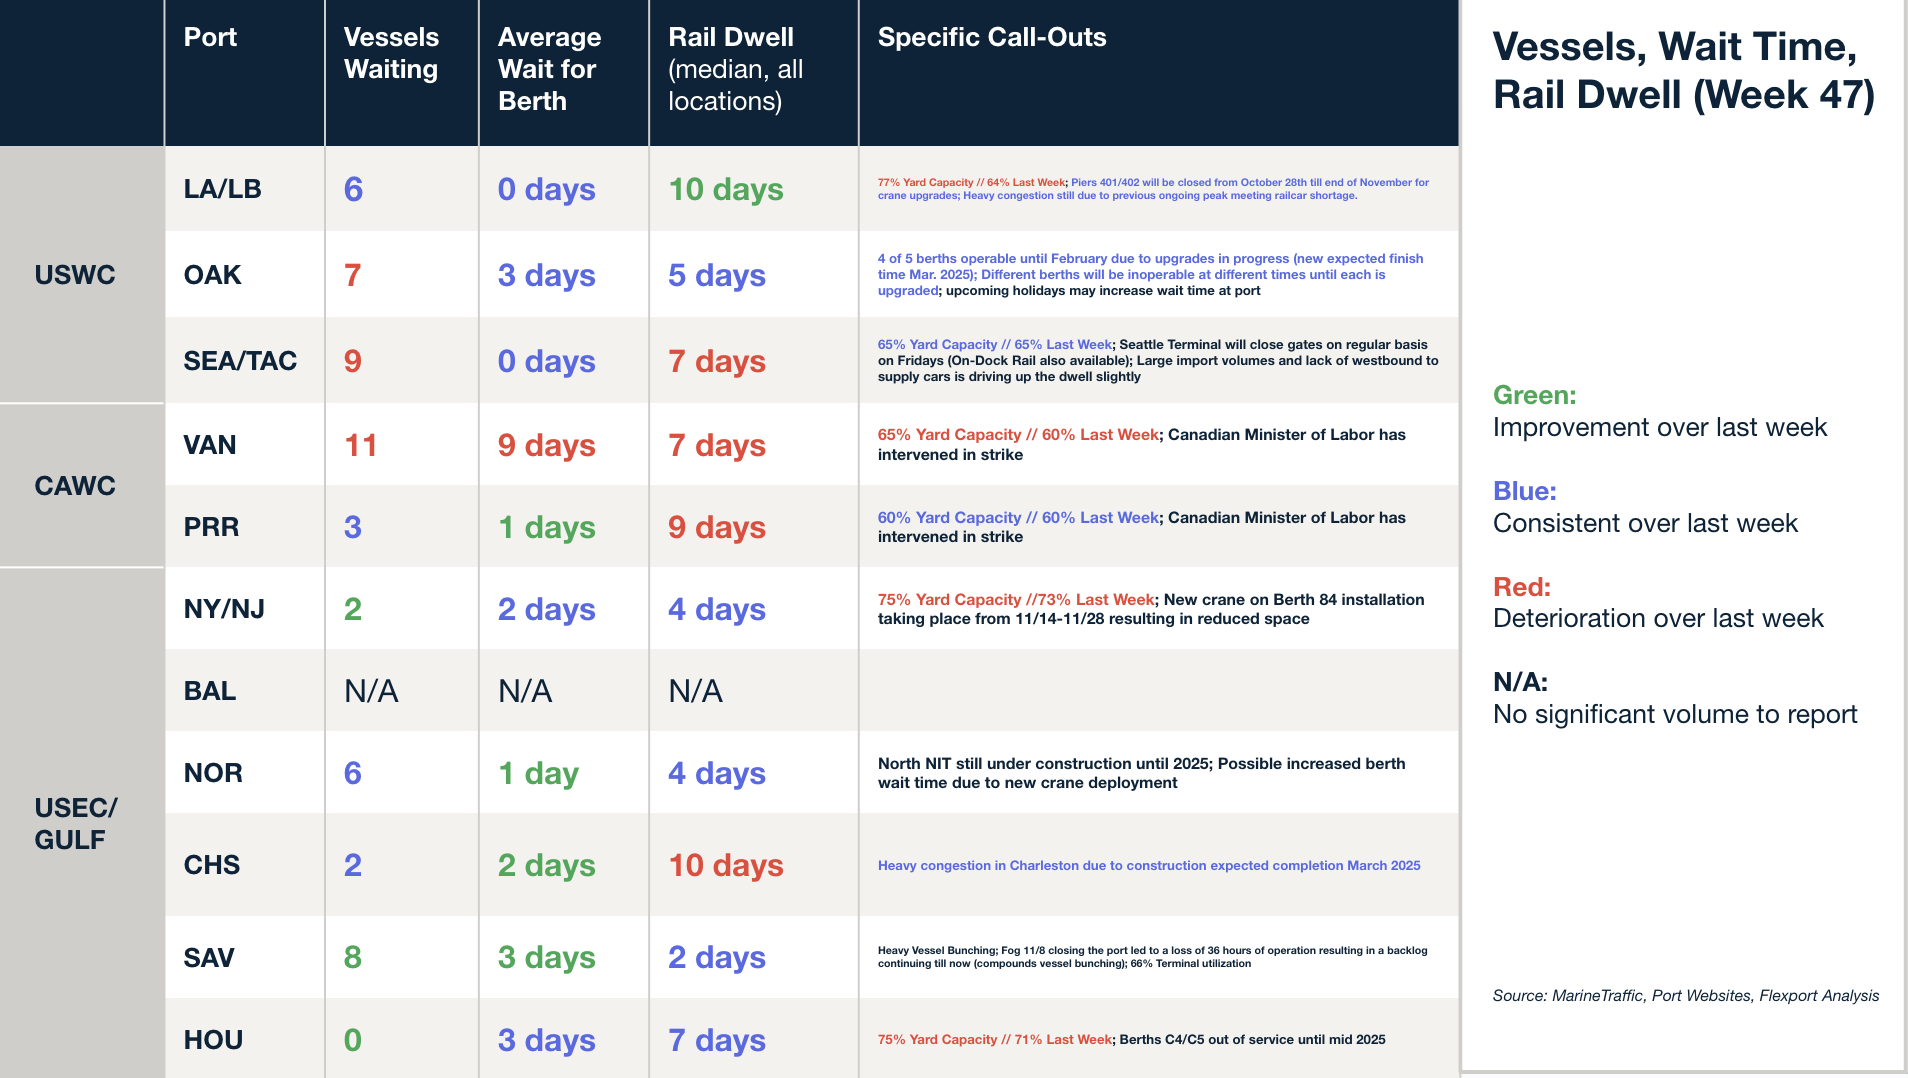
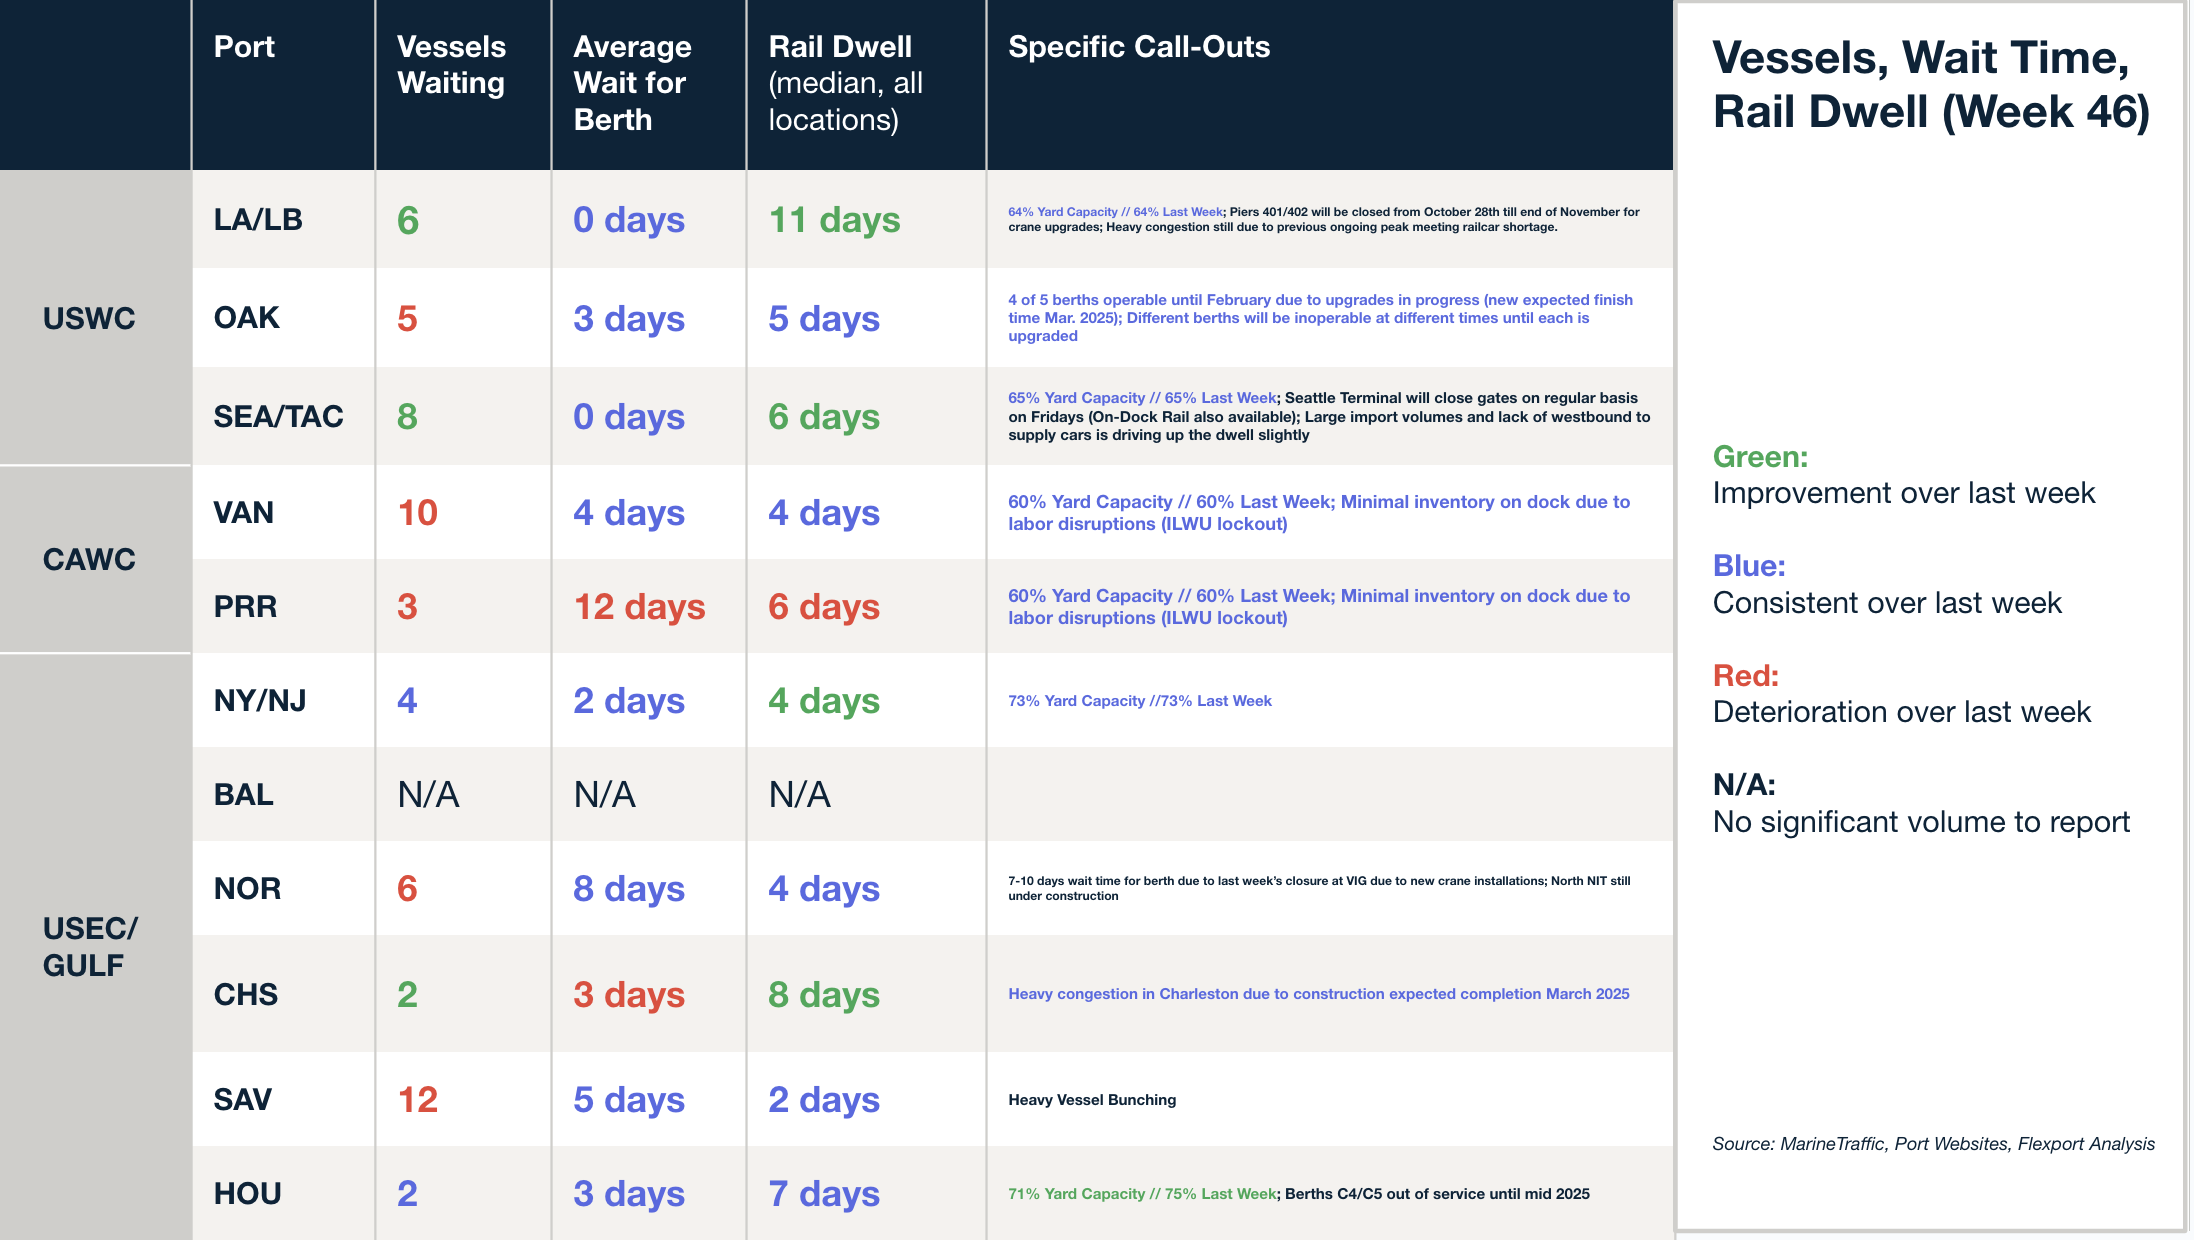
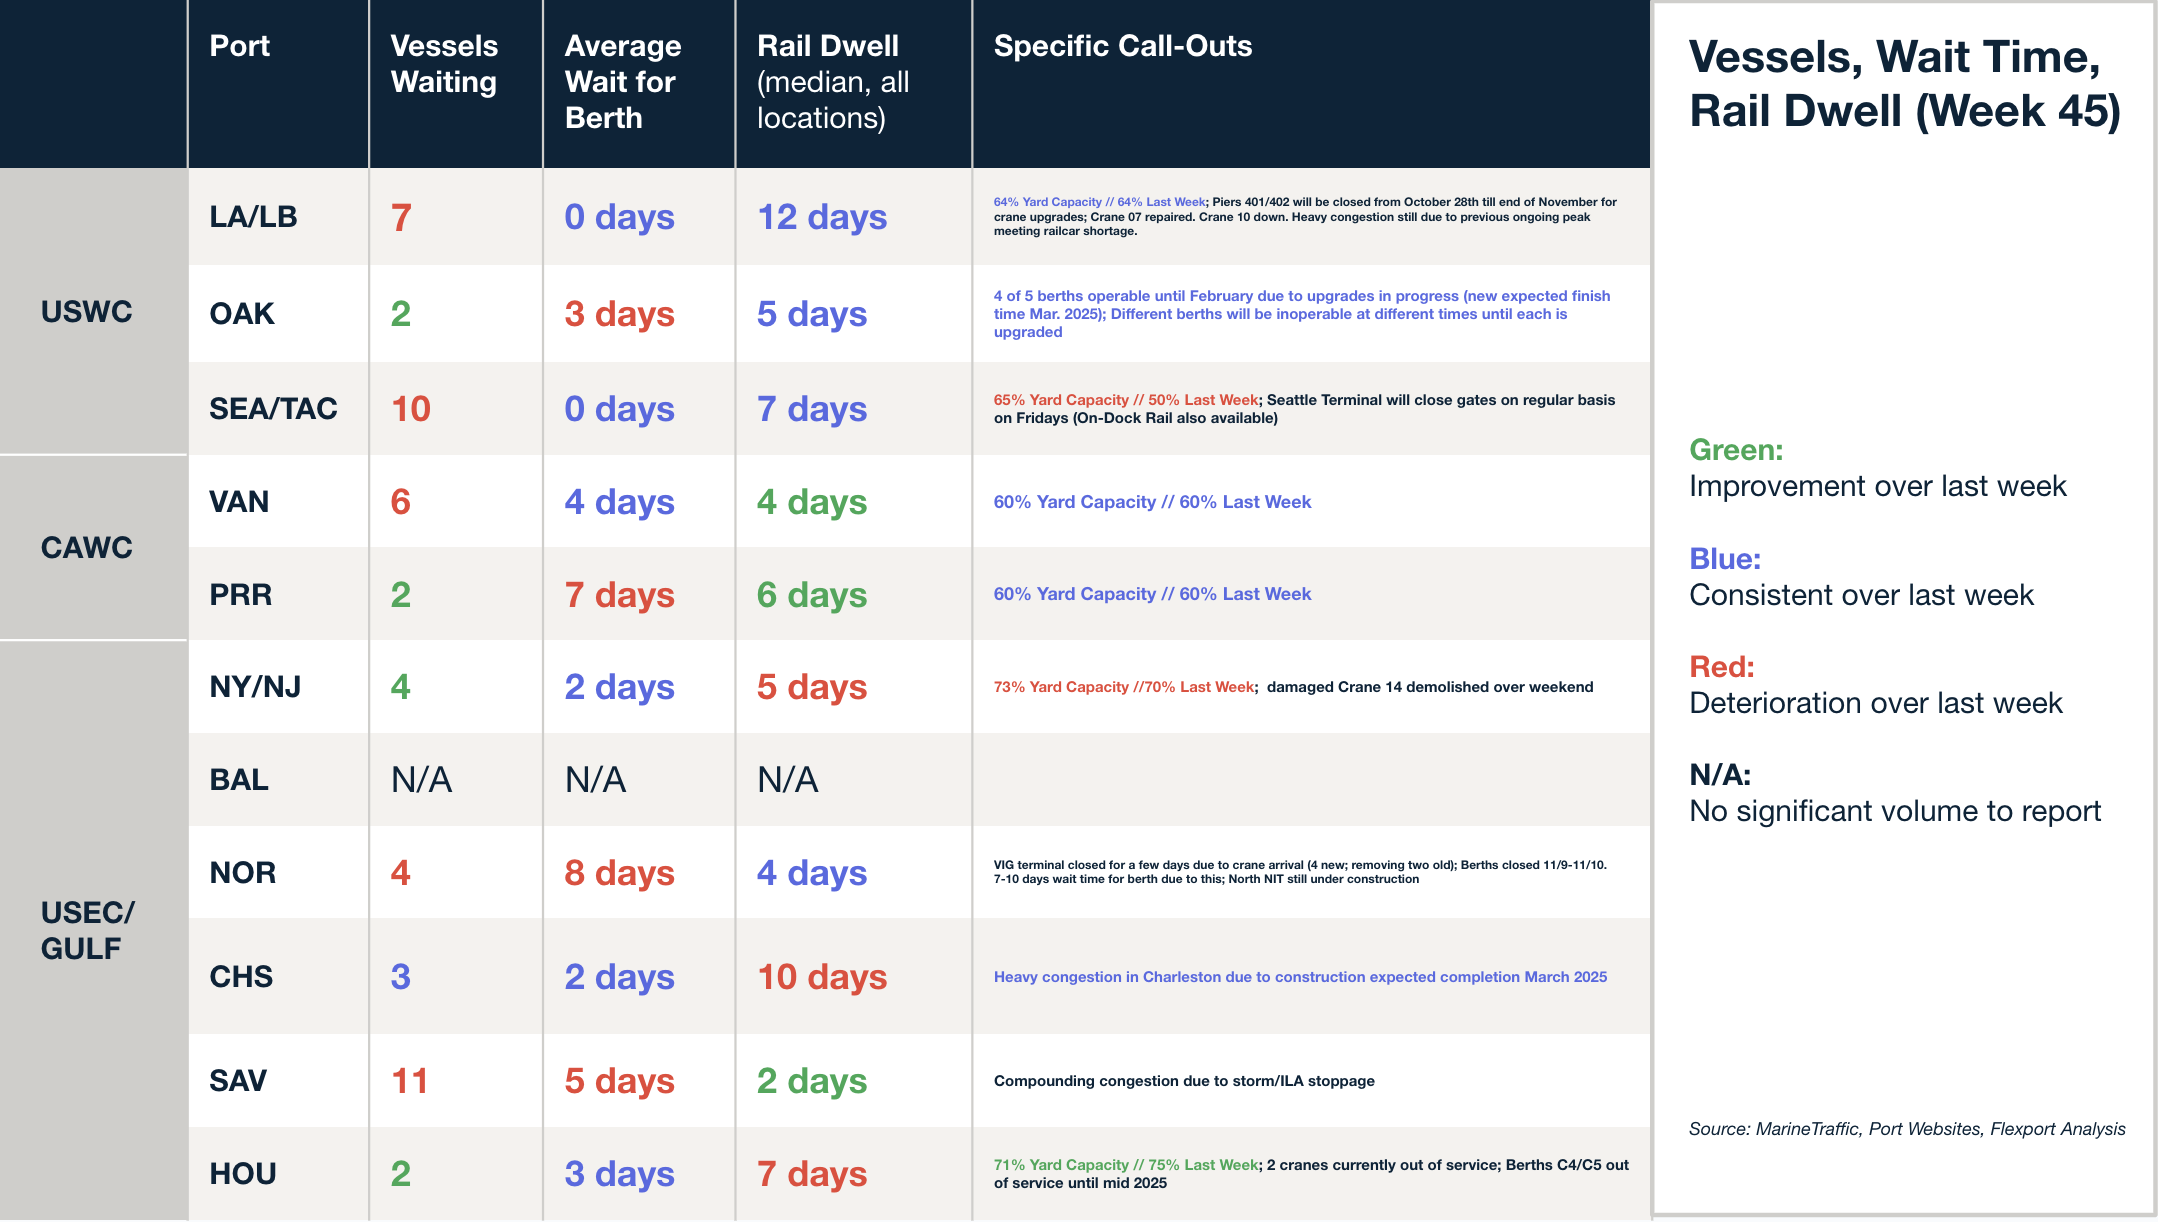
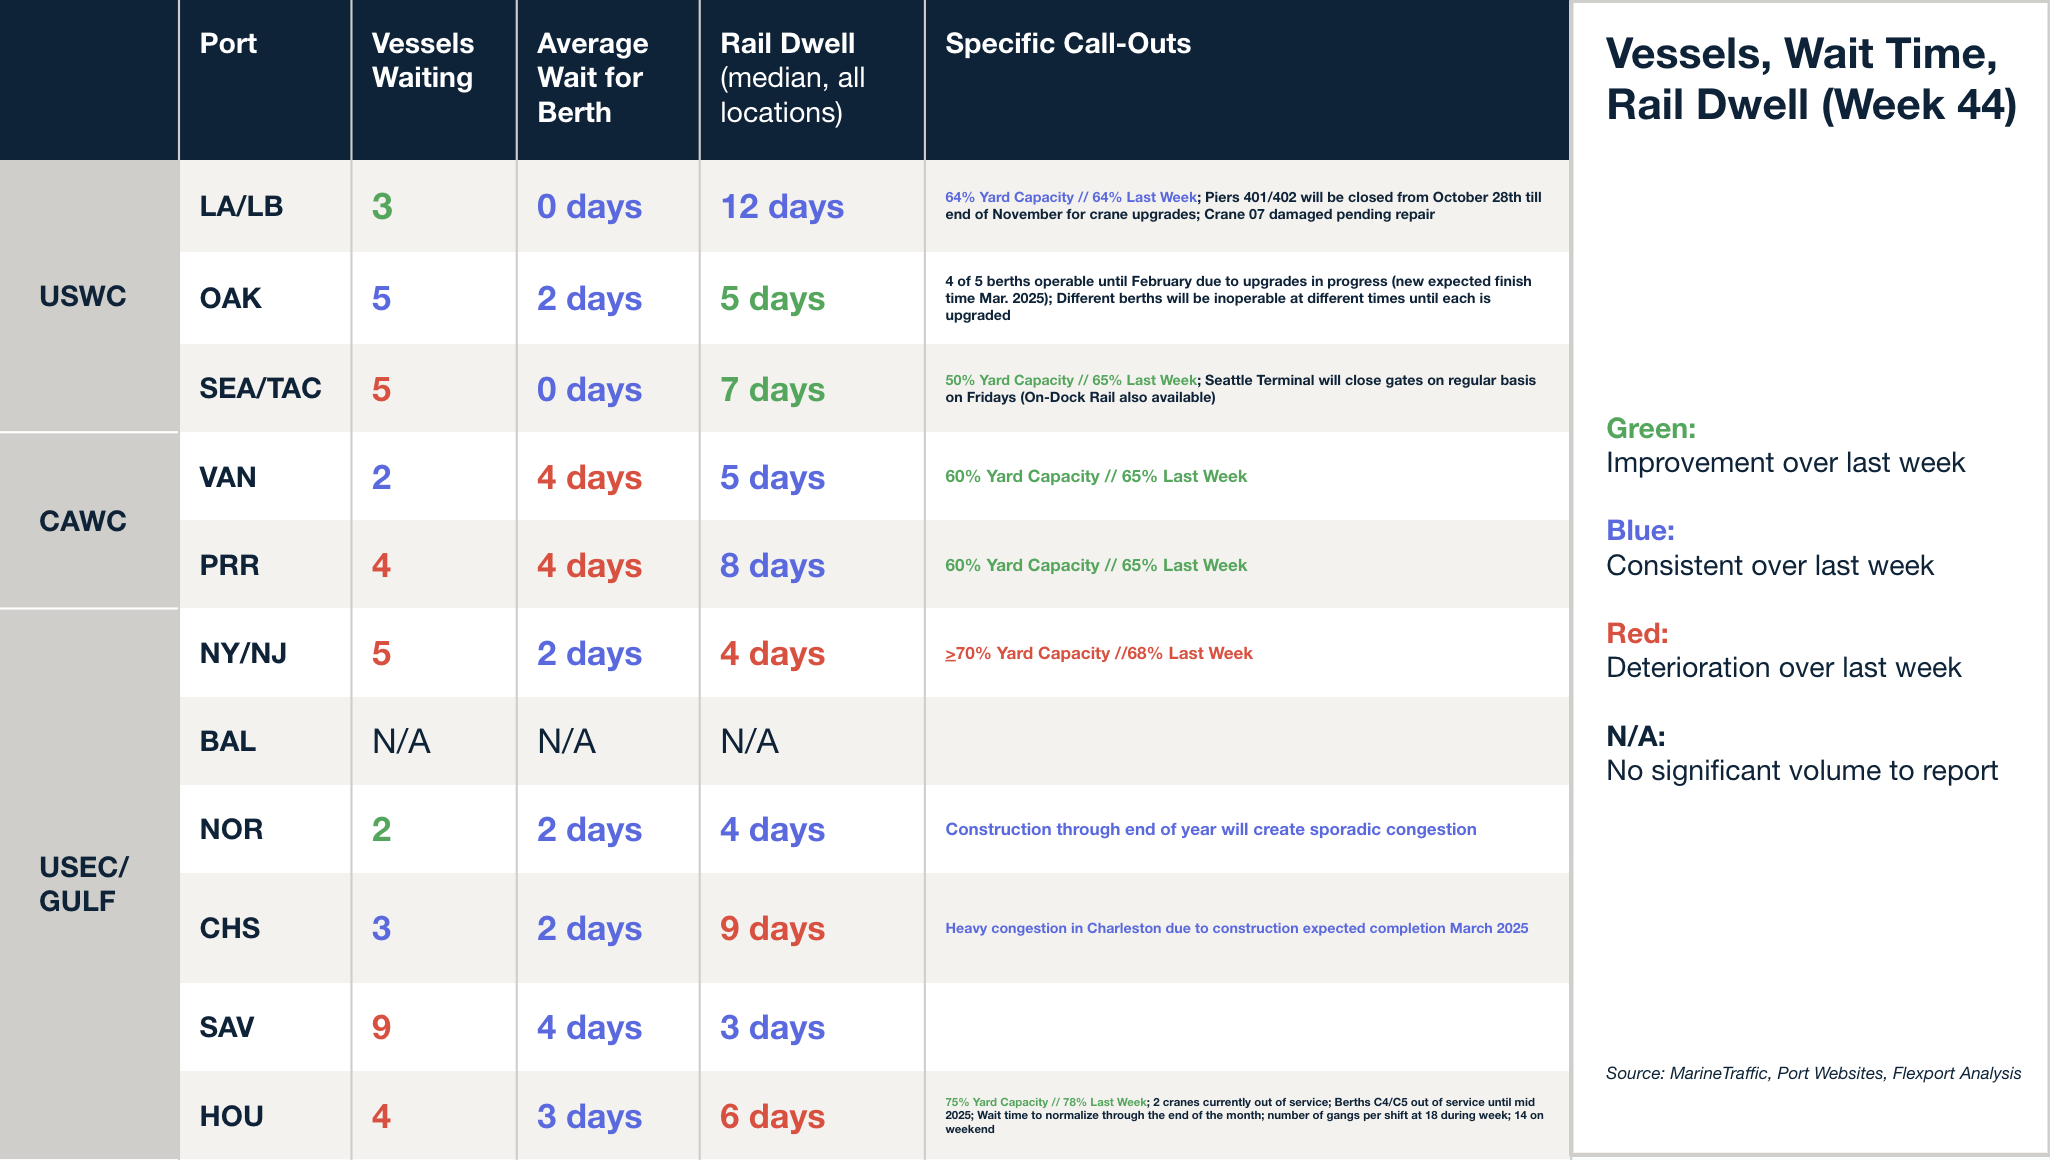
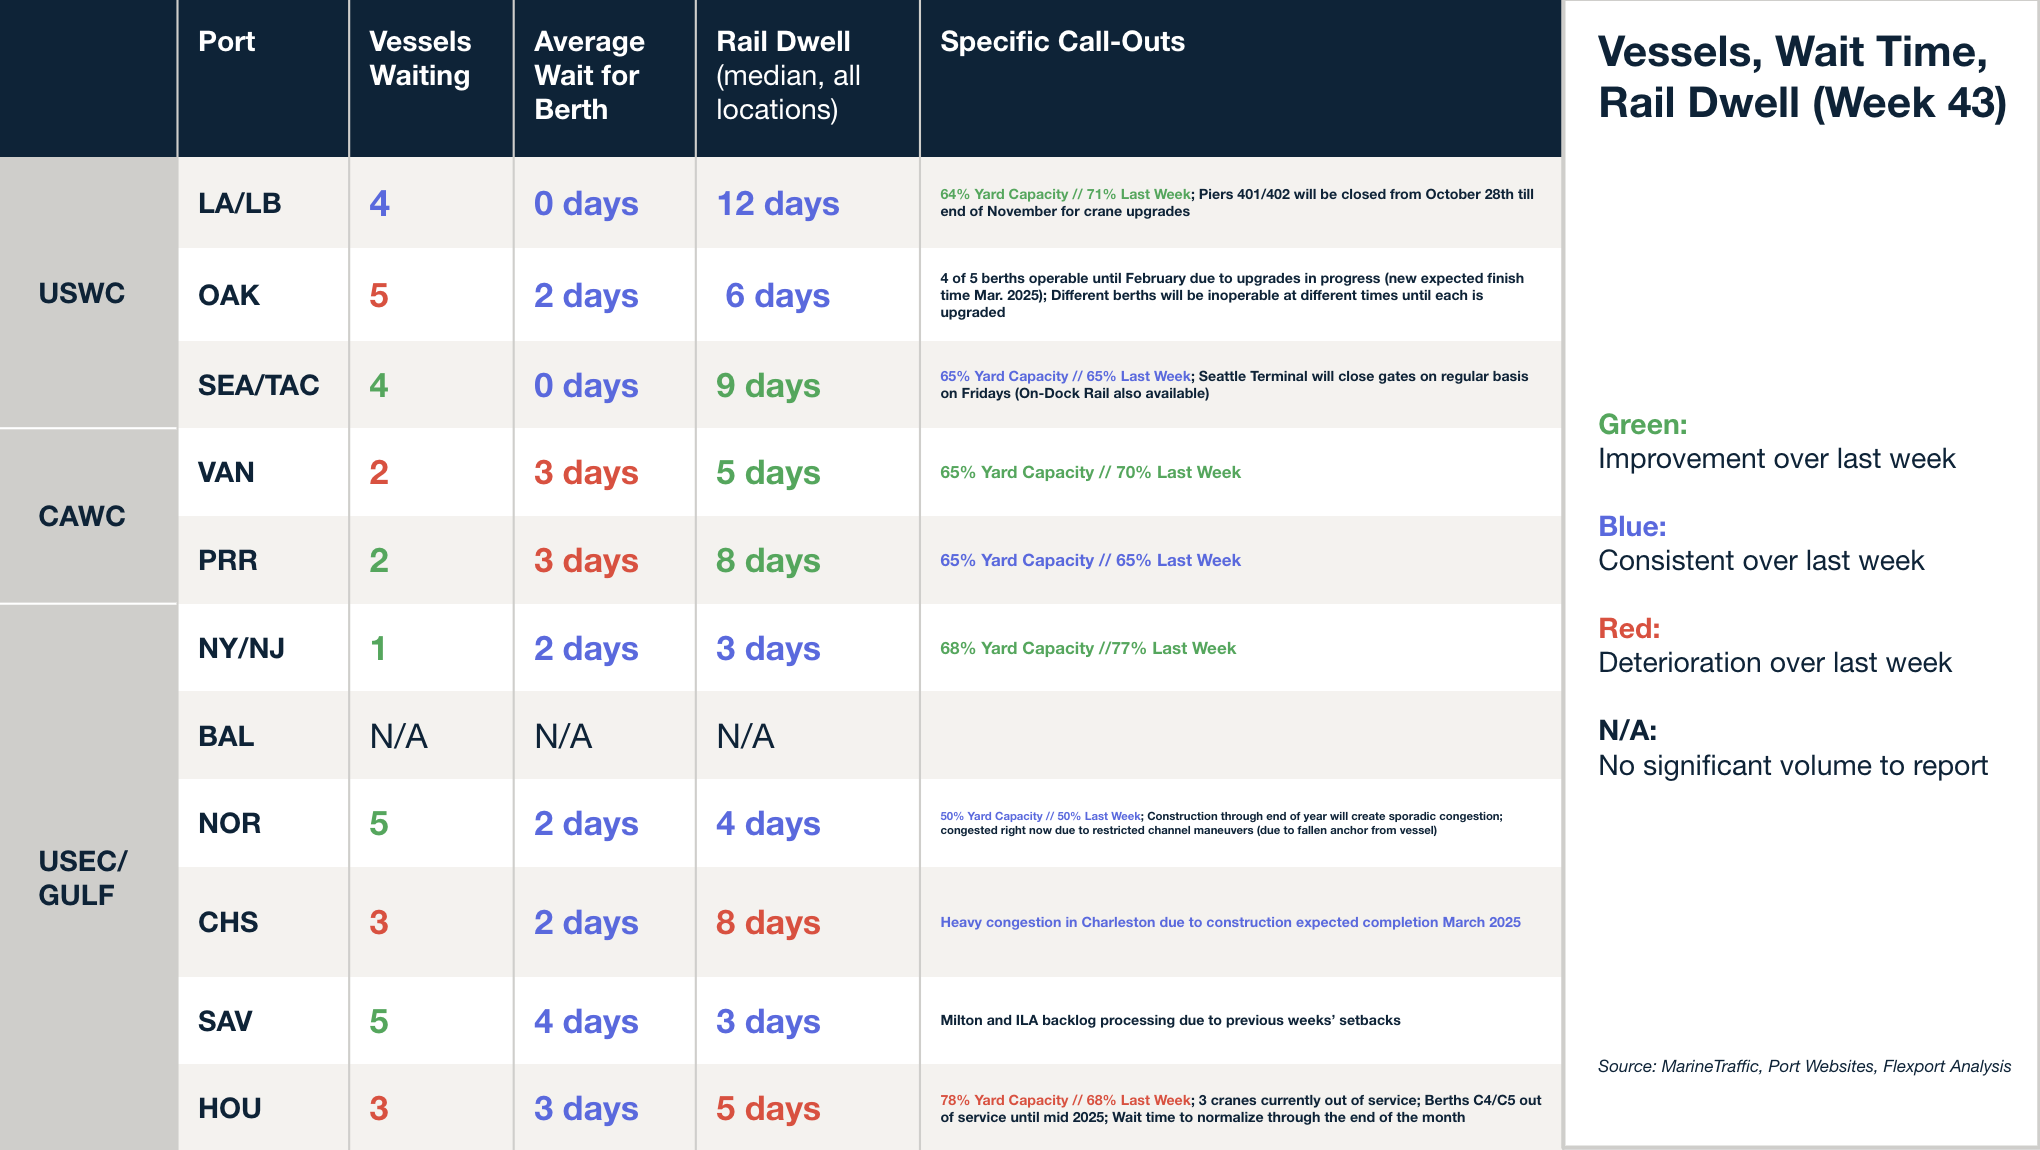
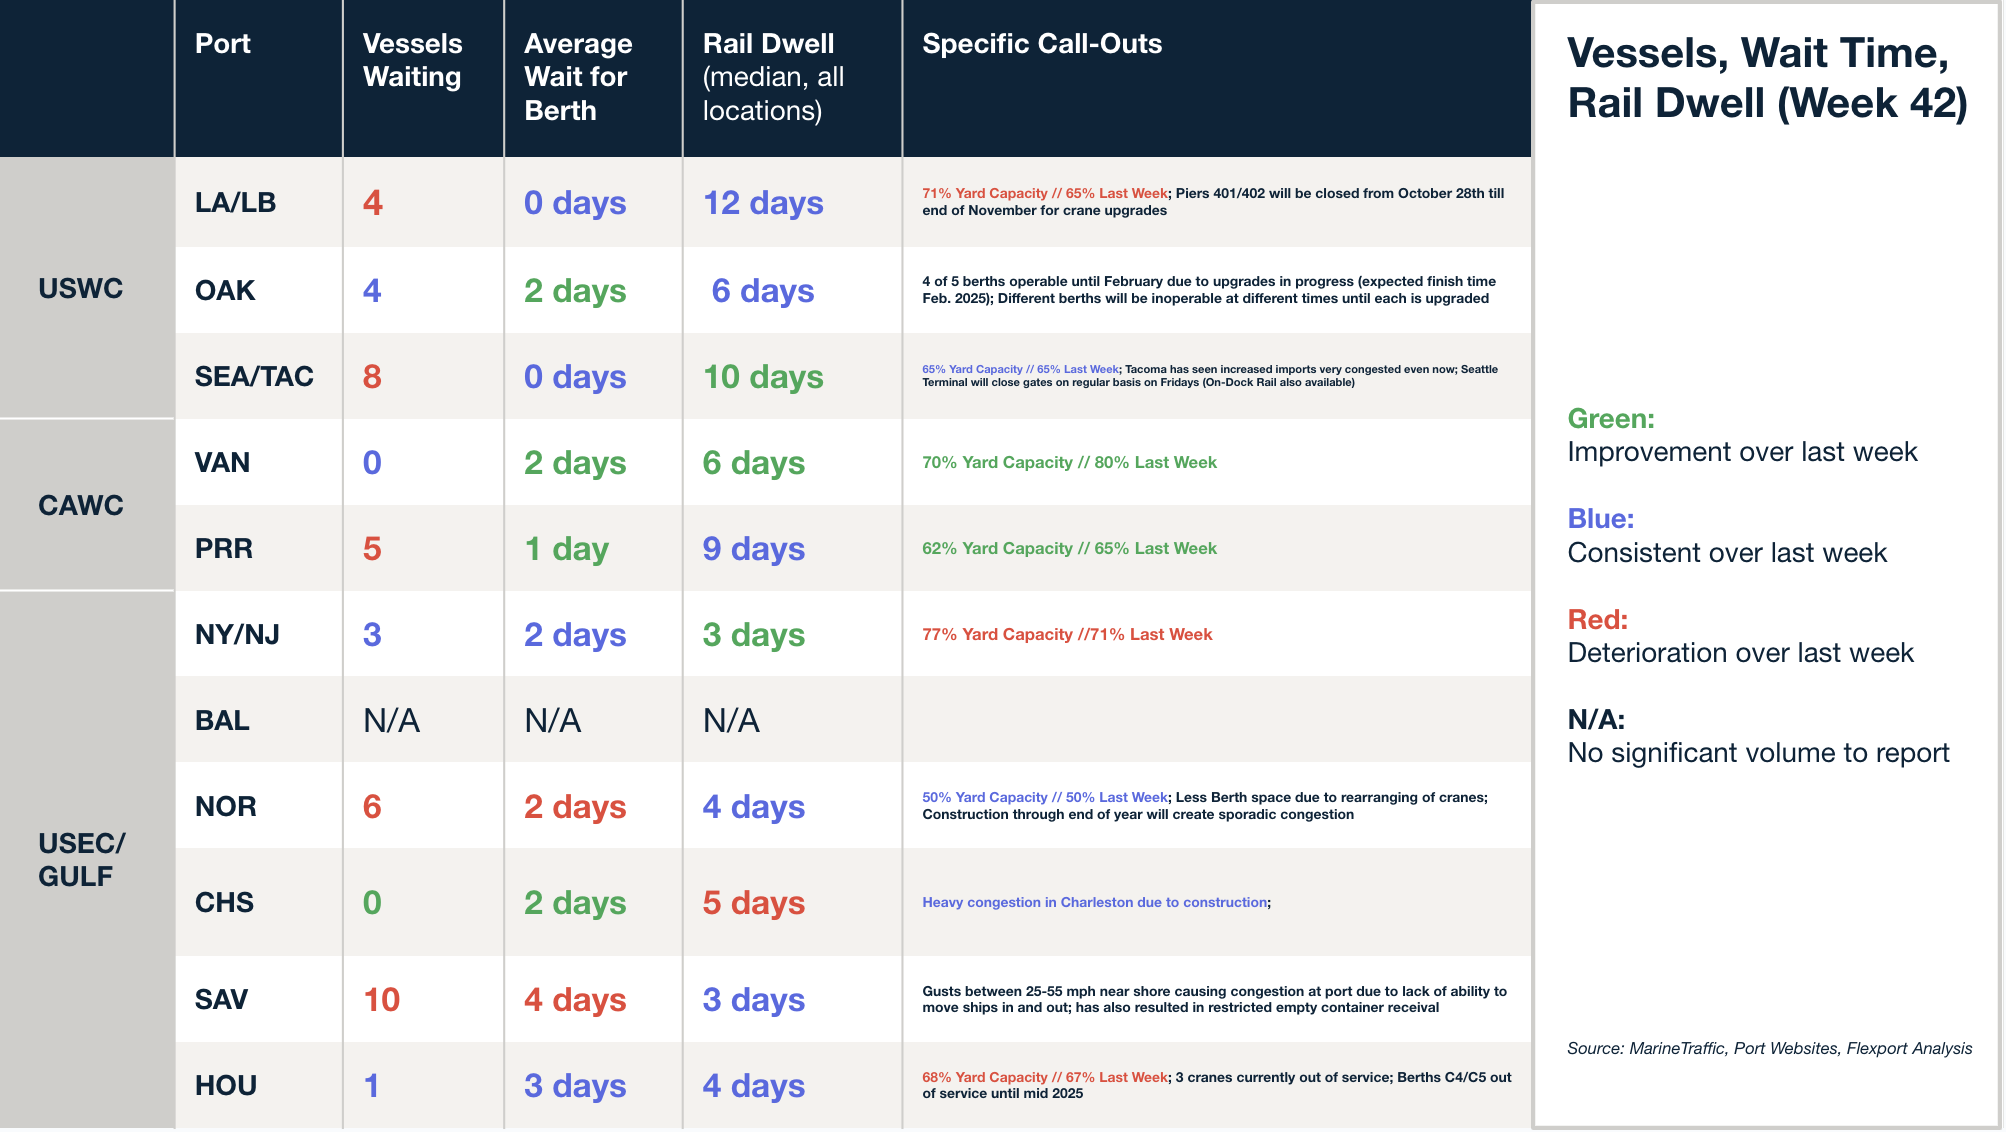
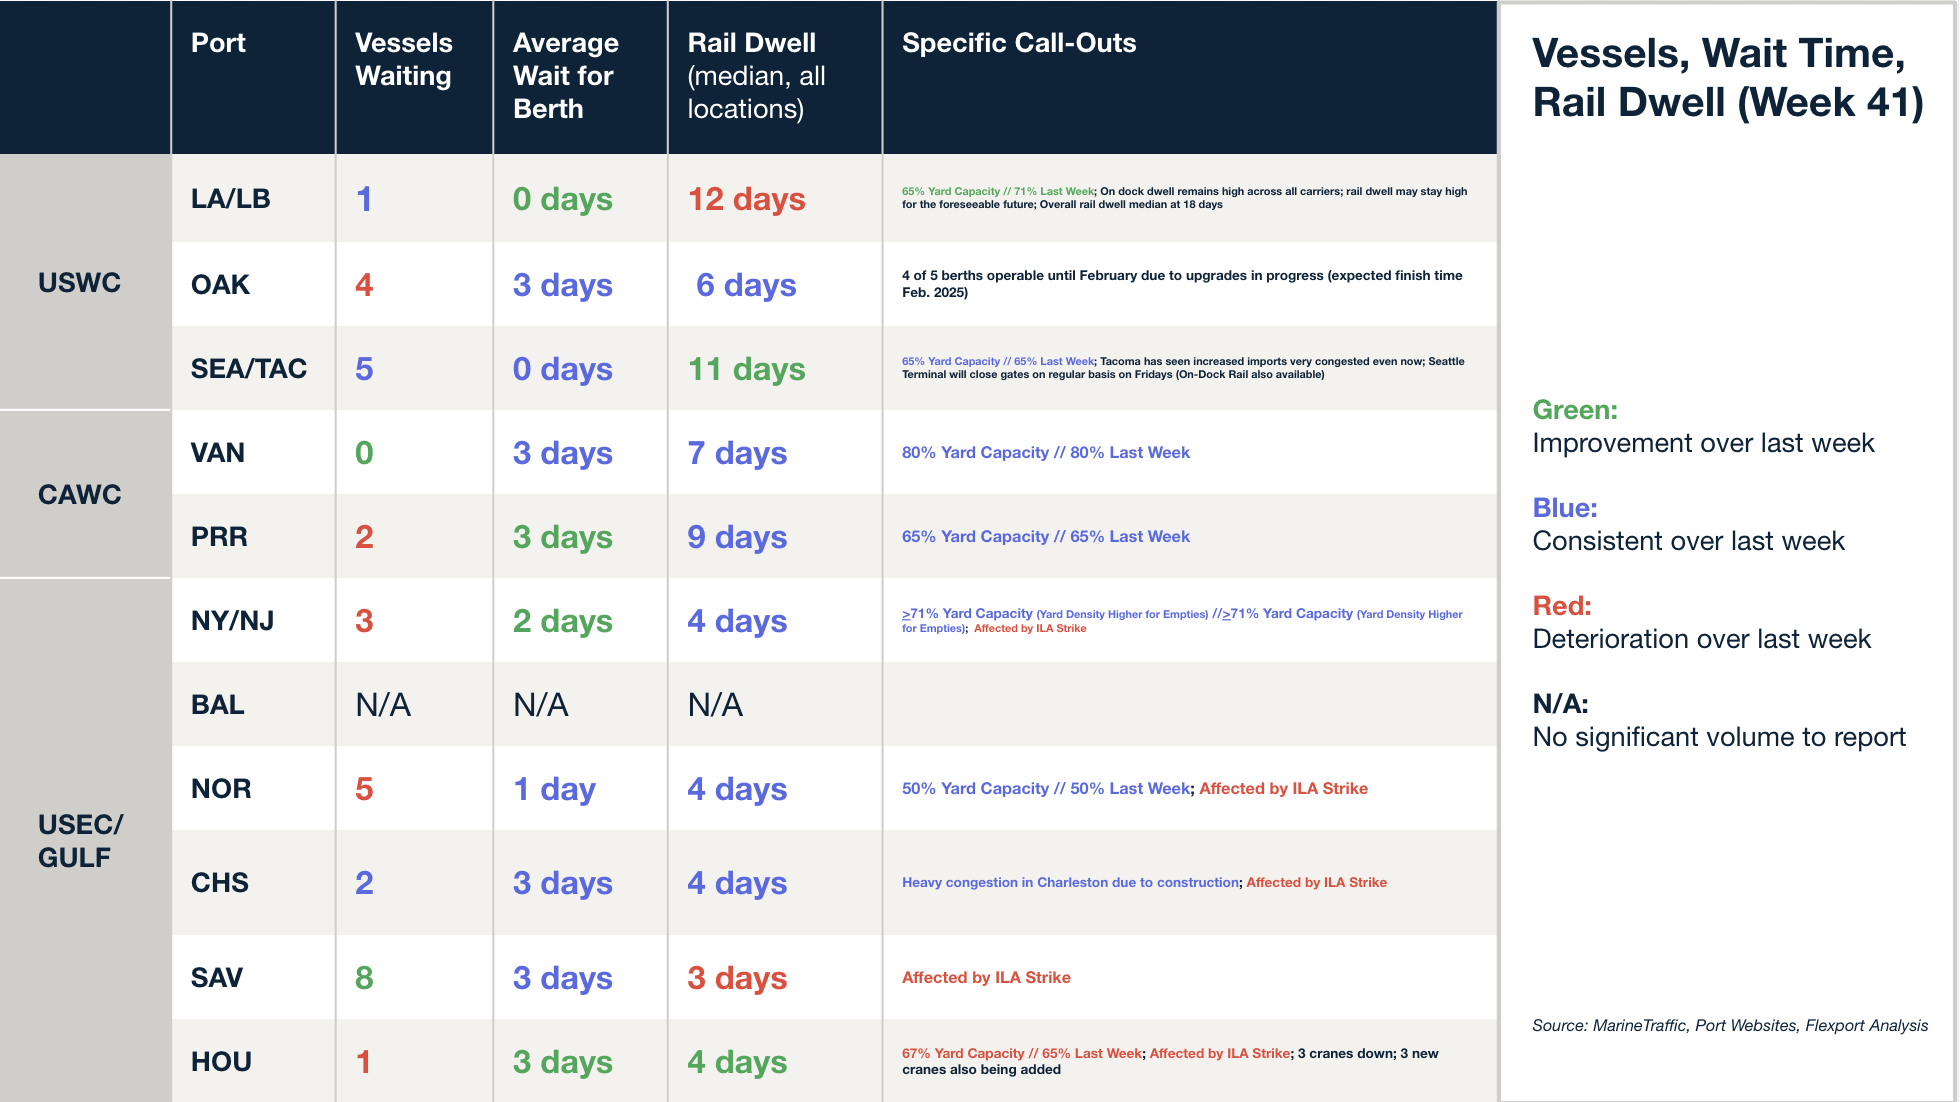
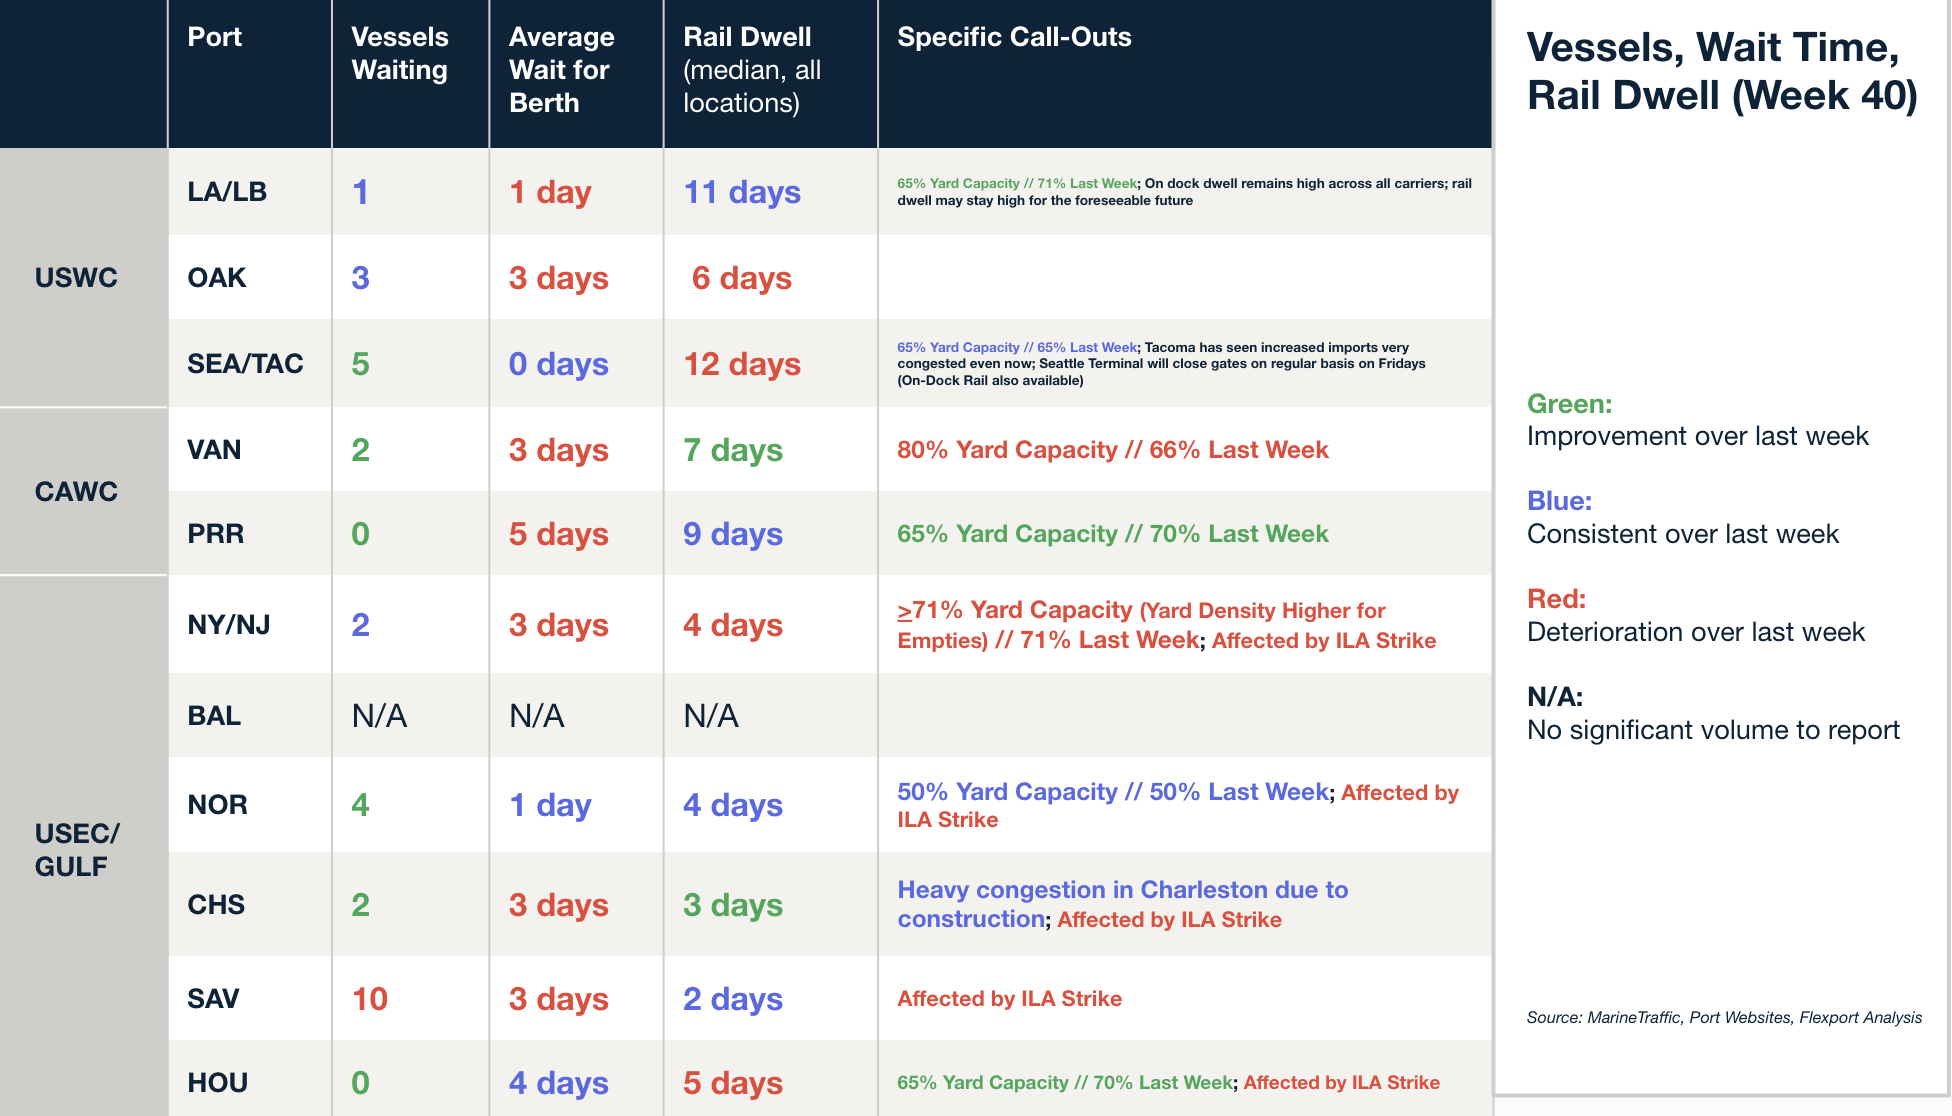
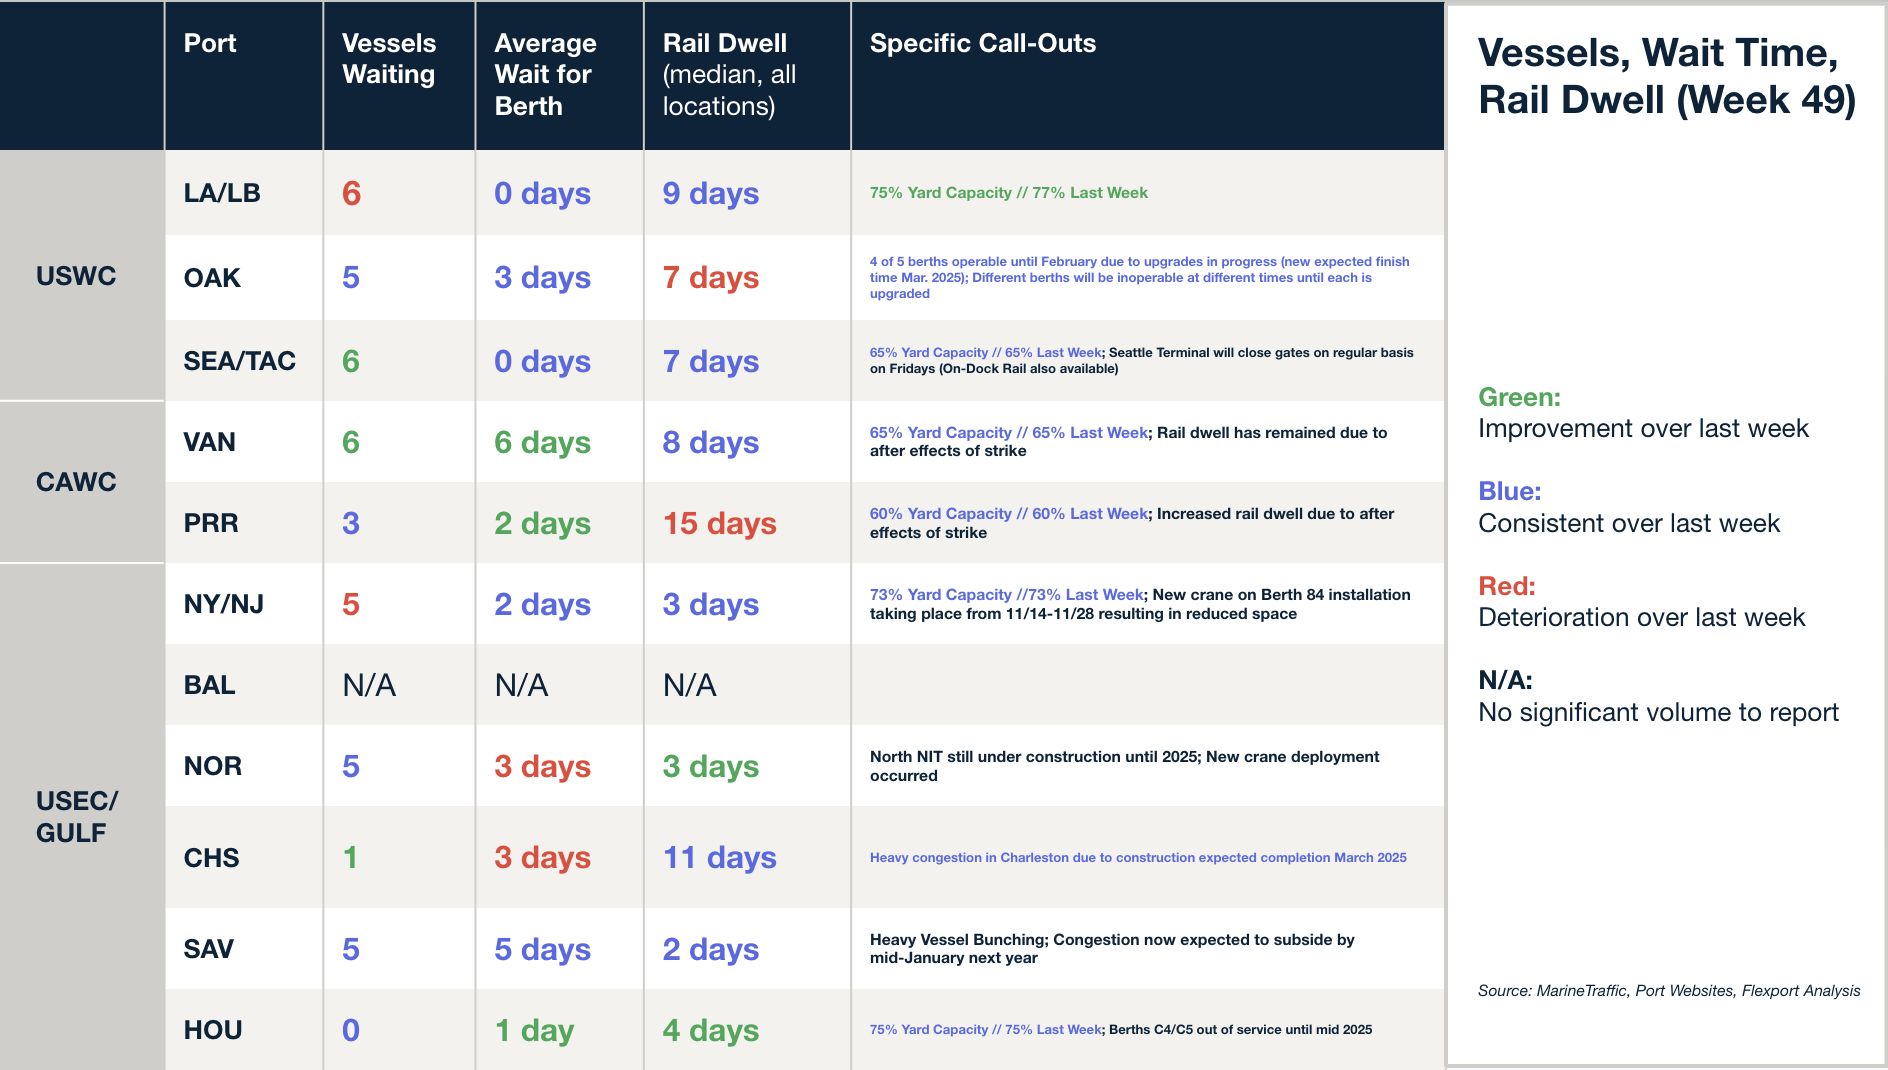
North America Vessel Dwell Times
This Week in News
Ryan Petersen, Flexport’s founder and CEO, appeared on CNBC’s Closing Bell: Overtime last Friday (November 29) to share his perspective on the holiday shopping season amid looming challenges, including the potential for a second East Coast port strike, tariff uncertainties, and more. As retailers are entering the holiday season facing significant headwinds: a shortened shopping period, the potential effects of President-elect Trump’s proposed tariffs, and lingering disruptions from October’s port strike, Petersen described this holiday season as the most challenging year-end for businesses since the onset of COVID-19.
Flexport is using generative AI to create the “holy grail” of shipping — Freethink
Flexport uses AI to modernize global trade logistics. The company employs generative AI to digitize documents, streamline communication with truckers via AI bots, and develop “knowledge agents” that centralize expertise on trade regulations and logistics. These innovations aim to automate 50% of manual tasks by 2025, reducing global shipping costs by 5%.
ILA targets rail-mounted gantry cranes amid impasse in port labor talks — Journal of Commerce
The International Longshoremen’s Association (ILA) is at an impasse with the US Maritime Alliance (USMX) over the introduction of semi-automated rail-mounted gantry cranes (RMGs), a key point in ongoing contract negotiations to avoid a January port strike. While RMGs increase terminal capacity and efficiency, especially in land-constrained East Coast ports, the union views them as a threat to jobs, safety, and national security, citing risks of hacking and job elimination. The USMX argues that embracing automation is essential for ports to remain competitive, but the ILA remains firm, framing the fight as a pivotal moment for the union’s future.
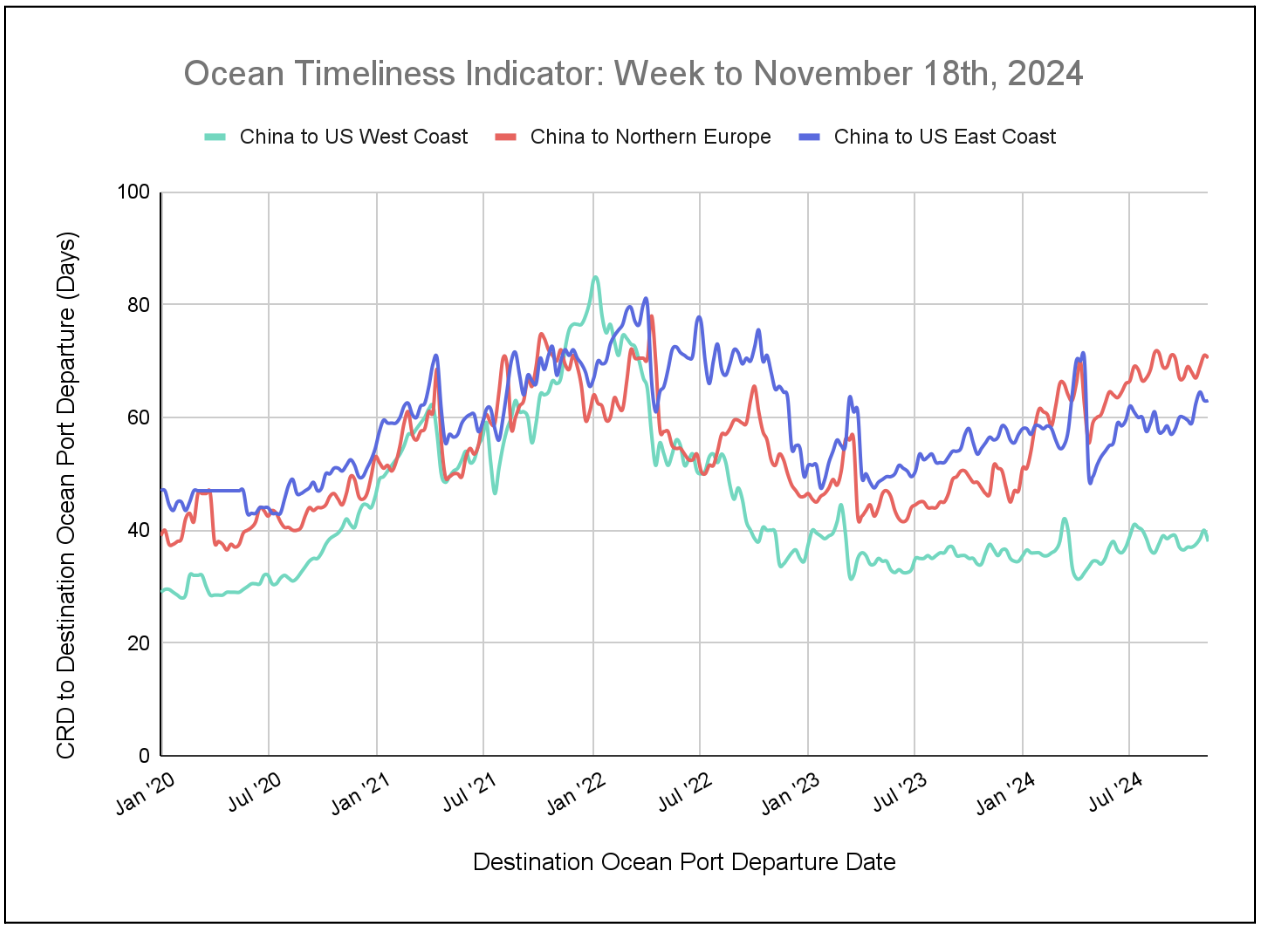
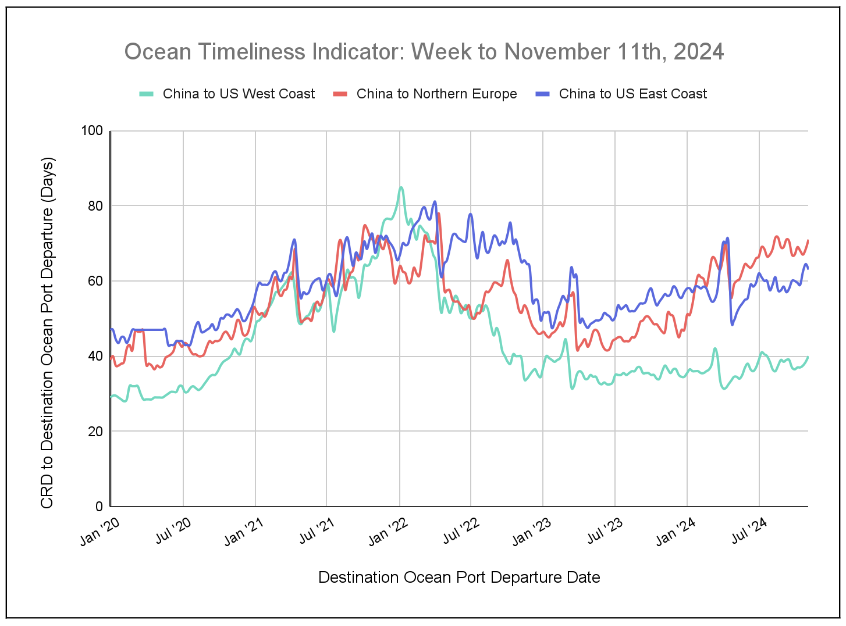
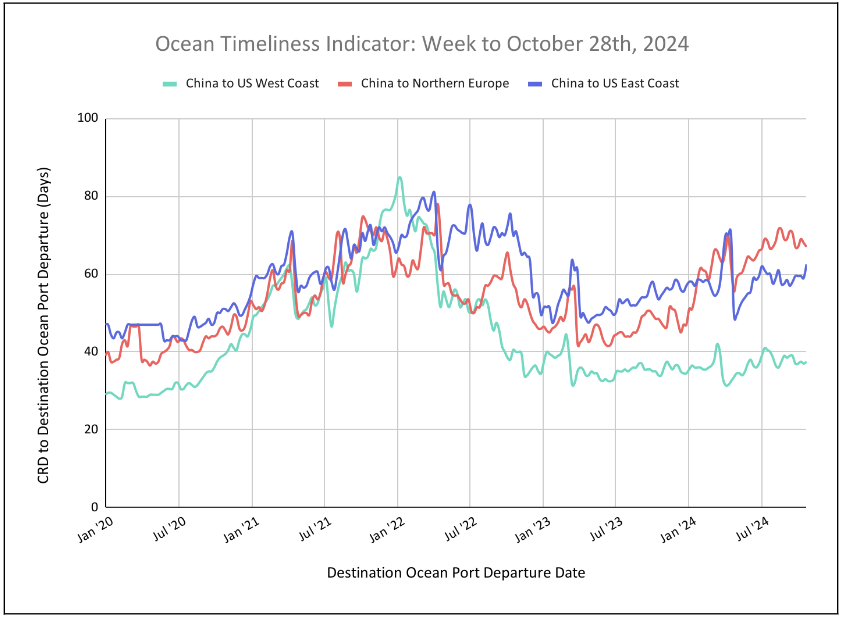
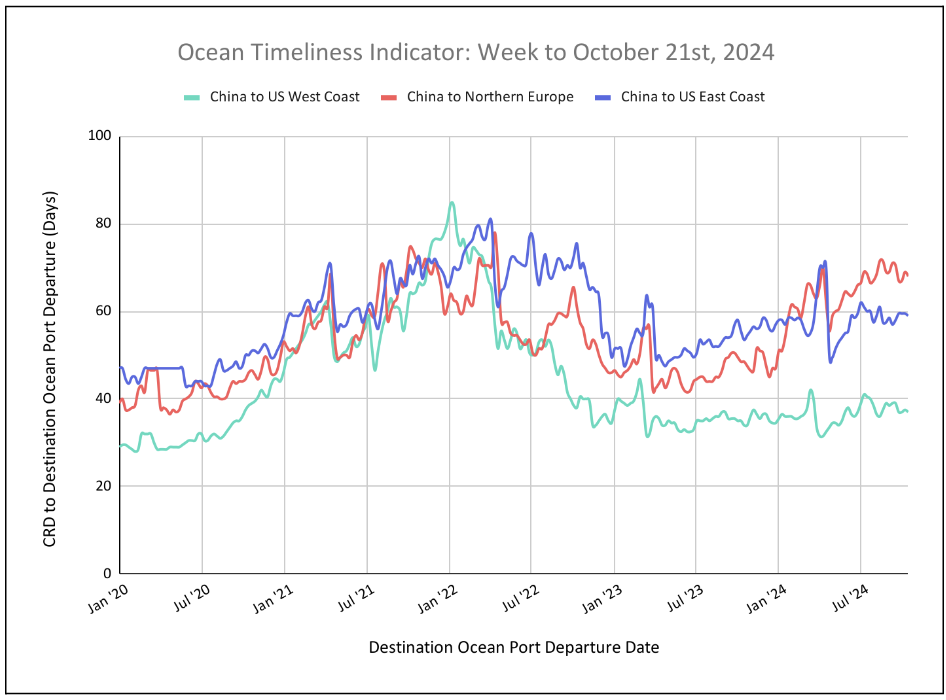
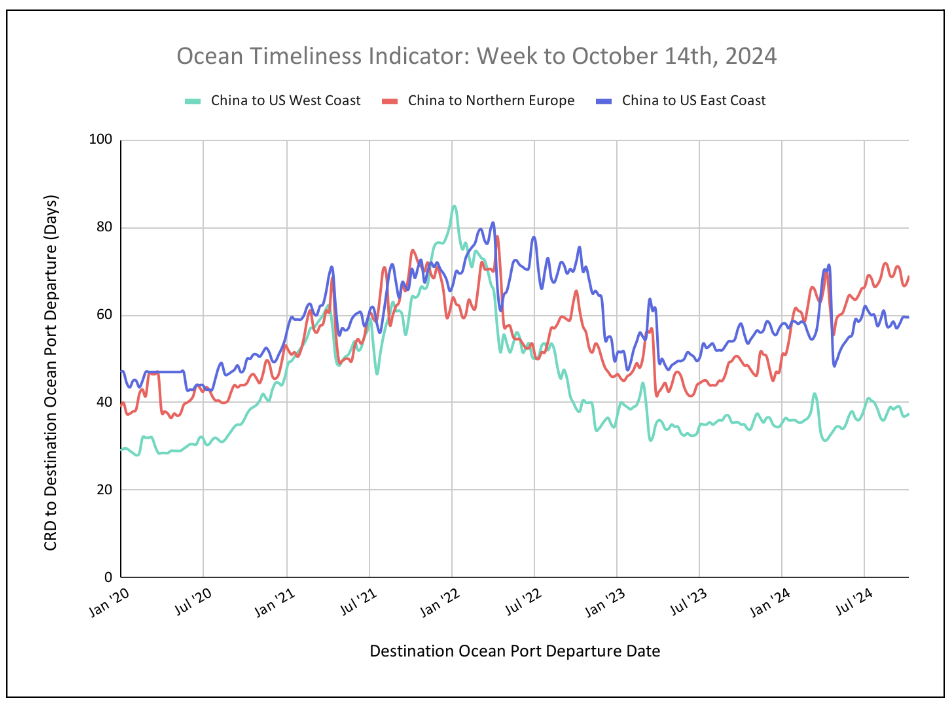
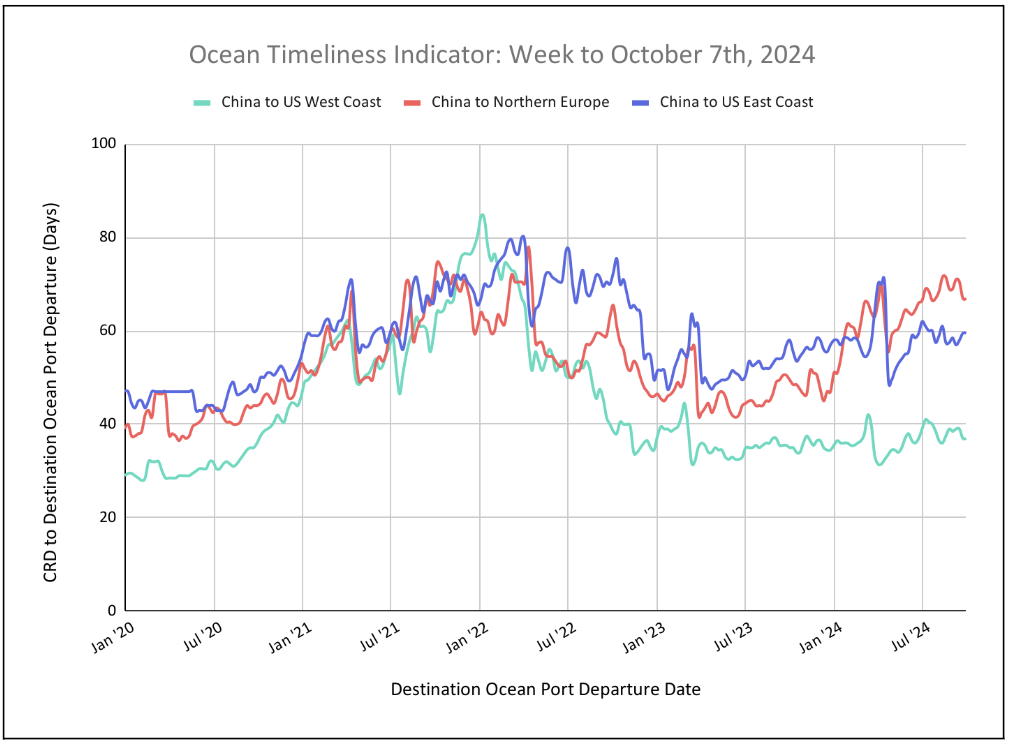
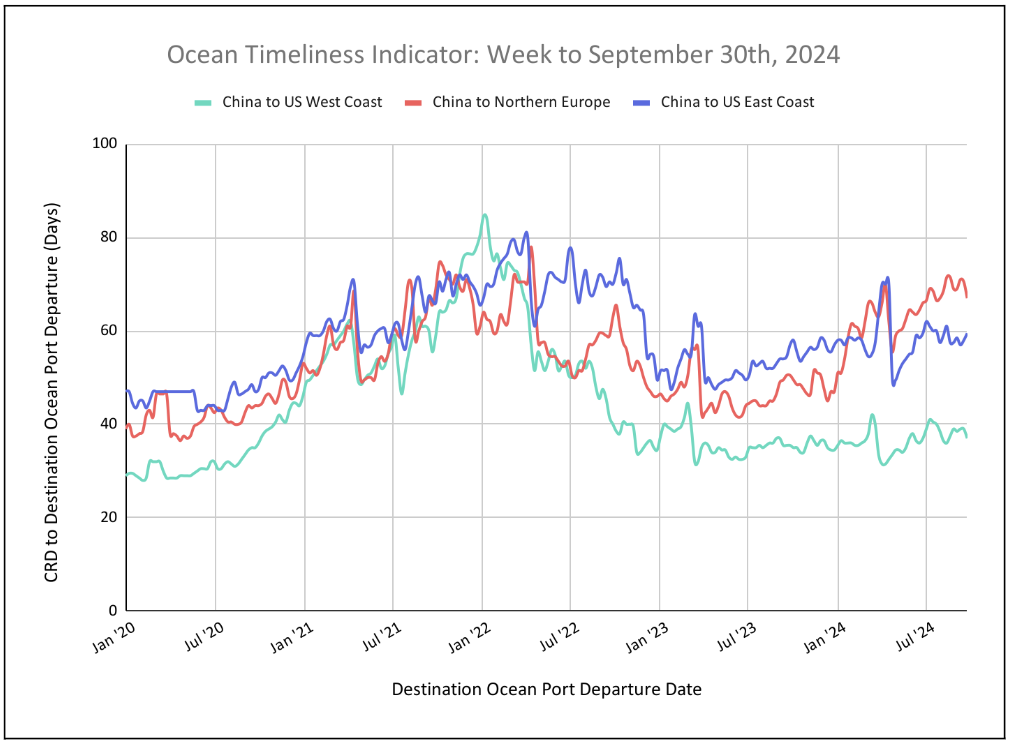
Flexport Ocean Timeliness Indicator
This week, the Flexport OTI is showing minor fluctuations, with small drops from China to Northern Europe and China to the U.S. East Coast. Meanwhile, the OTI remains stable for China to the U.S. West Coast.
Week to December 2, 2024
This week, the Ocean Timeliness Indicator (OTI) has remained stable for China to the U.S. West Coast at 35.5 days. Meanwhile, China to Northern Europe came down by half a day, falling from 71 to 70.5 days, and China to the U.S. East Coast by one day, moving from 63.5 to 62.5 days.

Source from Flexport.com