Trends to Watch
[Update on Canada Railroad Labor Negotiations]
- Canada’s two largest railways – Canadian National Railway (CN) and Canadian Pacific Kansas City (CPKC) – have locked out more than 9,000 workers represented by the Teamsters labor union after contract negotiations broke down.
- This rail stoppage is the result of months of tense negotiations between the railways and 9,300 engineers, conductors, and yard workers. Despite last-minute efforts to reach a deal, talks broke down just before the midnight deadline, leading to the lockout.
- The consequences are huge. Canada’s railways move $1 billion worth of goods daily, and this stoppage could severely disrupt supply chains across North America. The ripple effects could hit industries ranging from agriculture to manufacturing, impacting both the U.S. and Canadian economies.
[Ocean – TPEB]
- Departed volumes remain strong, largely supported by additional extra loader capacity aimed at easing the backlog caused by the cargo rush from May to July. While clients currently report healthy inventory levels, we anticipate a potential softening in demand over the coming weeks. This could be impacted by structurally blank sailings resulting from Cape of Good Hope (COGH) routings and ongoing port congestion in Asia and North America. Adverse weather conditions around the COGH are expected to lead to further delays and capacity challenges for the U.S. East Coast (USEC).
- On a positive note, water levels at Gatun Lake have recovered, leading local authorities to ease weight restrictions for the Panama Canal.
- Floating rates: the General Rate Increase (GRI) announcement for the second half of August is facing downward pressure as some carriers begin to adjust FAK rates. Major shipping lines are holding off on immediate changes but are closely monitoring the situation, particularly in the face of looming work stoppages.
- Fixed rates: Peak Season Surcharge (PSS) discussions remain intense due to the rate gap between FAK and NAC, which currently does not support mitigations.
[Ocean – FEWB]
- Demand is stabilizing, with blank sailings and extra loaders at the same time for the end of August. Vessel utilization remains solid, while full capacity will return in September via THEA/2M. This may lead to vessel-filling challenges, should demand remain consistent with August levels.
- Floating rates have begun to decline in the second half of August—a pattern that will extend into early September—though they remain relatively high. Carriers are being more proactive in adjusting rates to better optimize capacity.
- For long-term named account business, carriers continue to restrict space and equipment availability as a priority measure.
- With the equipment shortage improving, some ports with fewer direct calls still anticipate potential shortages of specific container types, such as 20’GPs and 45’HCs.
[Ocean – TAWB]
- Some carriers have tried to increase rates from the Mediterranean for September. Ultimately, they’ve extended them due to the summer slack season, but will try again in October if demand strongly increases.
- Out of North Europe, carriers are pushing hard to increase FAK rates.
- Even though most factories are closed, demand remains stable due to last month’s capacity reduction.
- In general, there are no equipment shortages, except in some German inland depots.
[Ocean – U.S. Exports]
- Capacity from the U.S. to the Indian subcontinent and Middle Eastern ports has tightened, related to vessel omissions and blank sailings.
- Service strings relying on feeder services to final ports of discharge (PODs) are losing capacity as the appropriate vessels are being shifted to headhaul trades and congestion continues to deteriorate the repeat serviceability of the feeder lane.
- Challenges related to earliest return dates (ERDs) continue to persist for U.S. exporters.
- To ensure the smoothest loading experience, we recommend booking 2 weeks in advance for bookings loading at a coastal port, and 3-4+ weeks in advance for bookings loading at an inland rail point.
[Air – Global]
- Northern China’s market has started to pick up on both the FEWB and TPEB due to volume surges across ecommerce, Apple NPI, and other traditional air clients.
- Rates from Hong Kong / South China are stable so far, but we expect an increasingly constrained market in the weeks leading up to peak season.
Volcanic activity in the Russian peninsula has led to cancellations and tightened capacity this week. - Taiwan’s market remains congested. Direct space from Taiwan is expensive, but you can find cheaper options transiting via other Asia hubs (Korea, etc.).
- Vietnam’s market has temporarily declined due to heavy congestion associated with the summer holidays. Capacity will tighten again post-holidays (September).
- Capacity from the Indian subcontinent to North America and Europe remains constrained.
- Bangladesh’s operations have returned to normal. The local situation remains volatile, and there is a massive cargo backlog at origin.
- Capacity remains open and demand is stable from North American and European origins.
- Service was disrupted last week by natural disasters. Volcanic eruptions in Russia’s Kamchatka Peninsula have released ashes on flight routes, prompting a payload reduction for airlines from Asia to the U.S. and Europe. The situation is back to normal now. This is expected to occur again throughout Q4 2024, as the volcano is still active. A typhoon near Japan last week led to service failures and congestion for Japanese carriers. While more typhoons are anticipated in Asia during this peak season, their impacts are expected to remain localized.
Please reach out to your account representative for details on any impacts to your shipments.
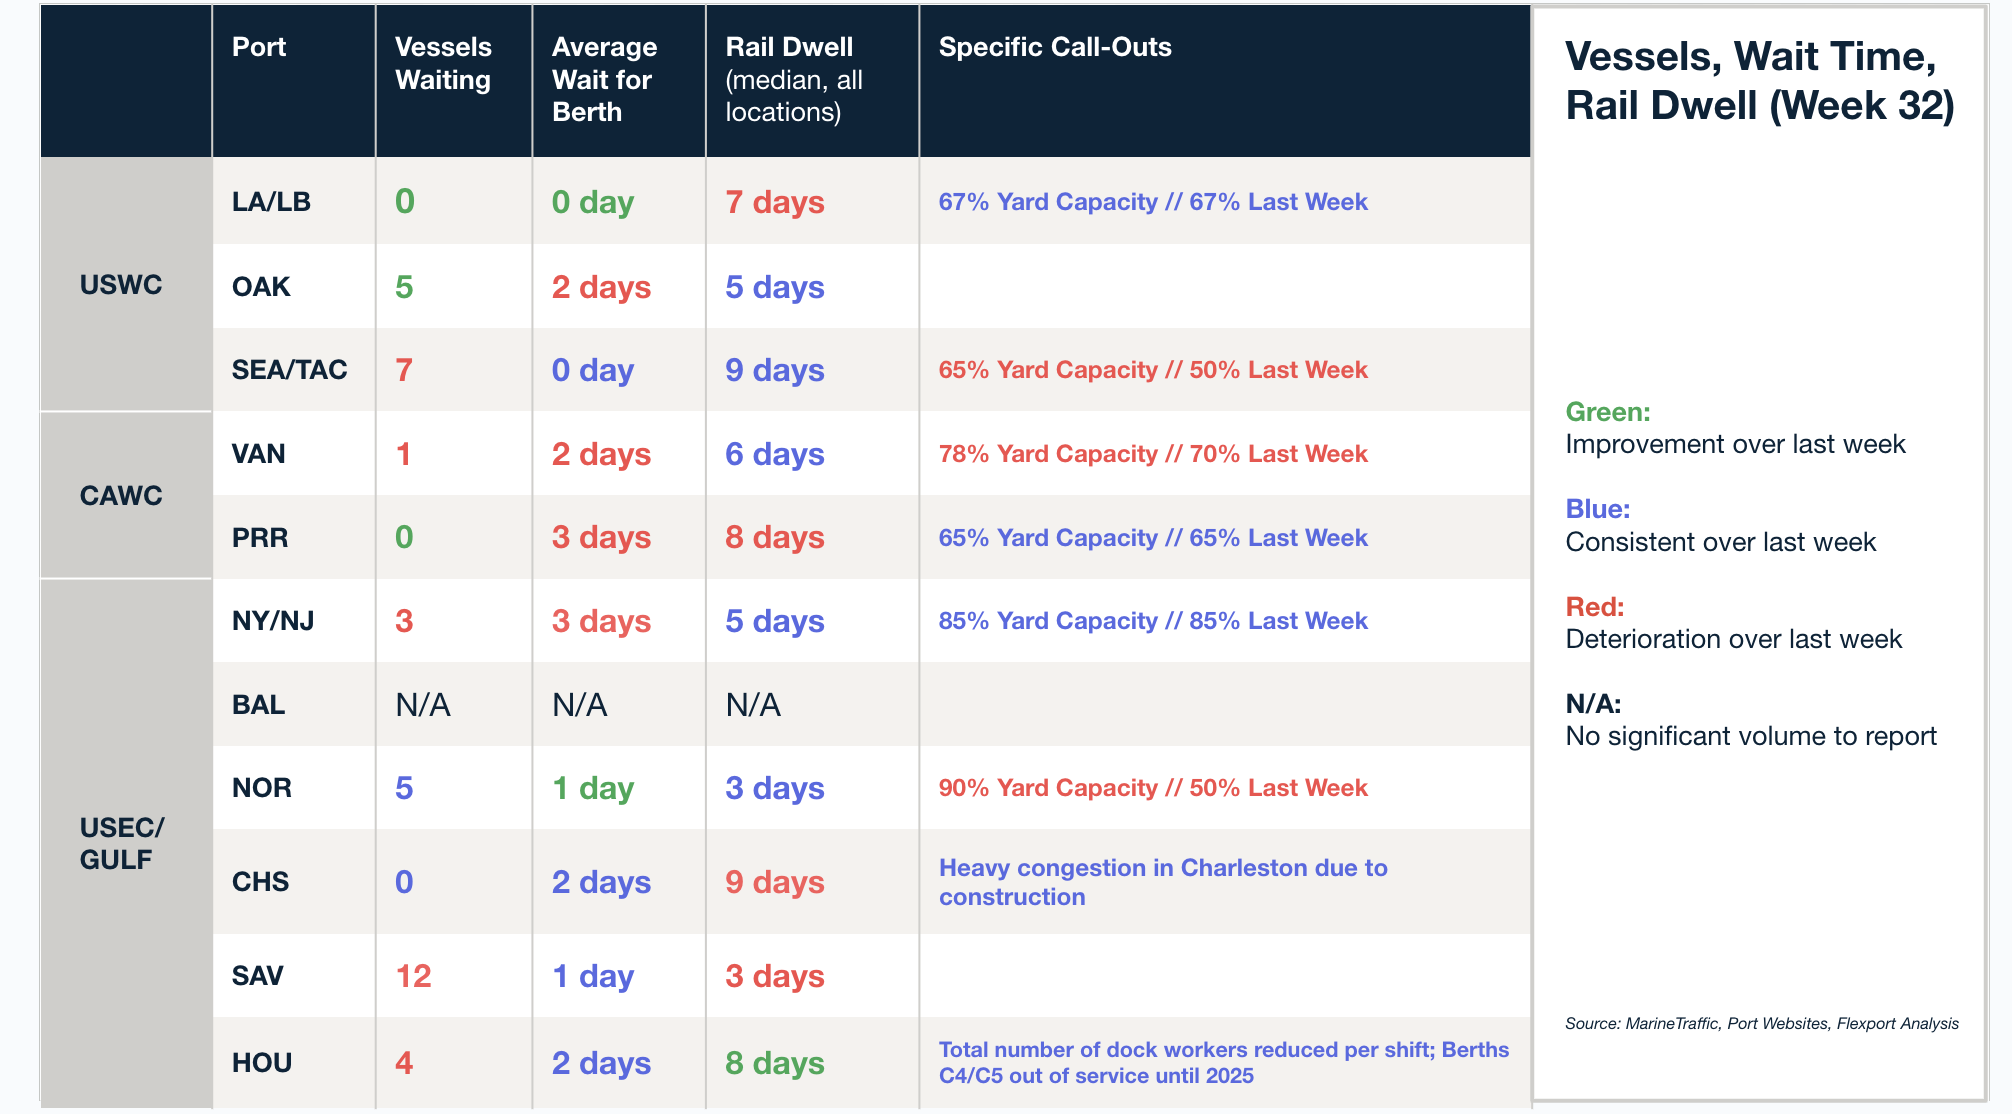
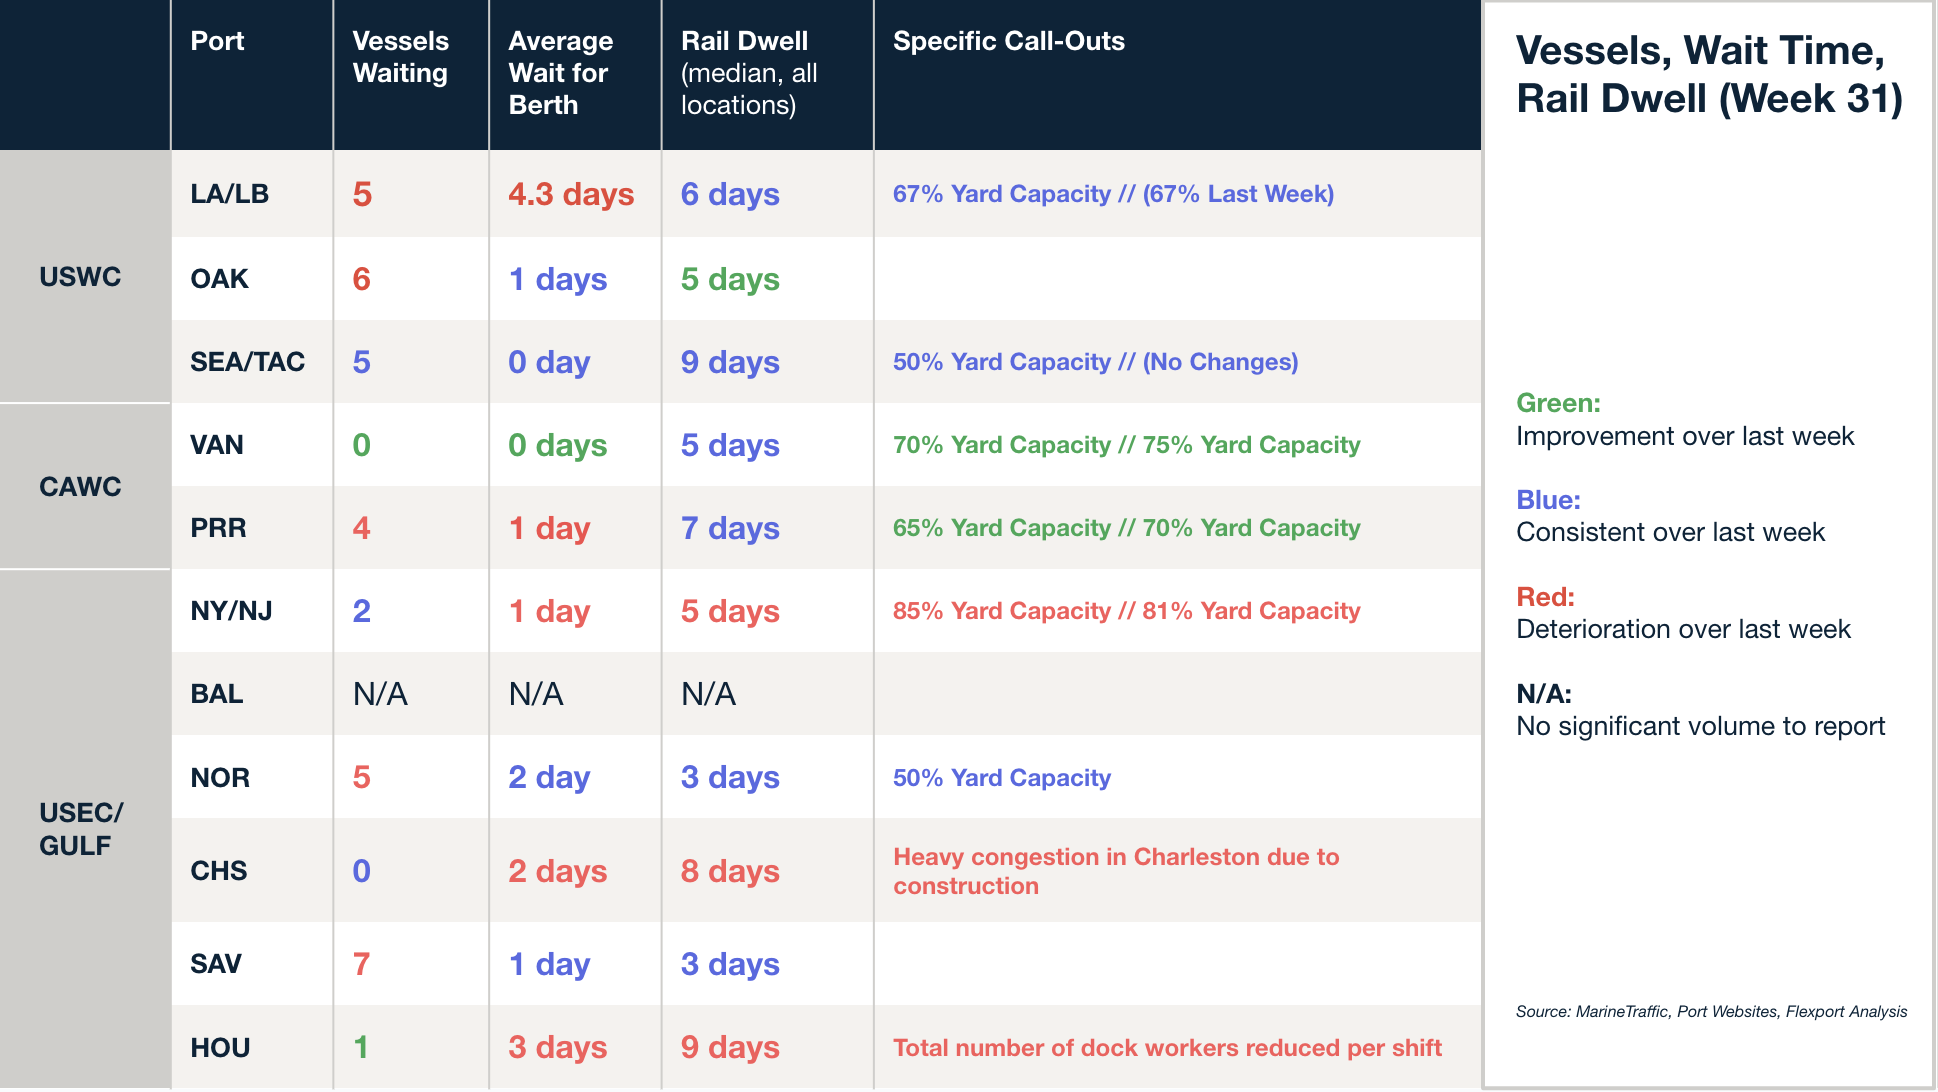
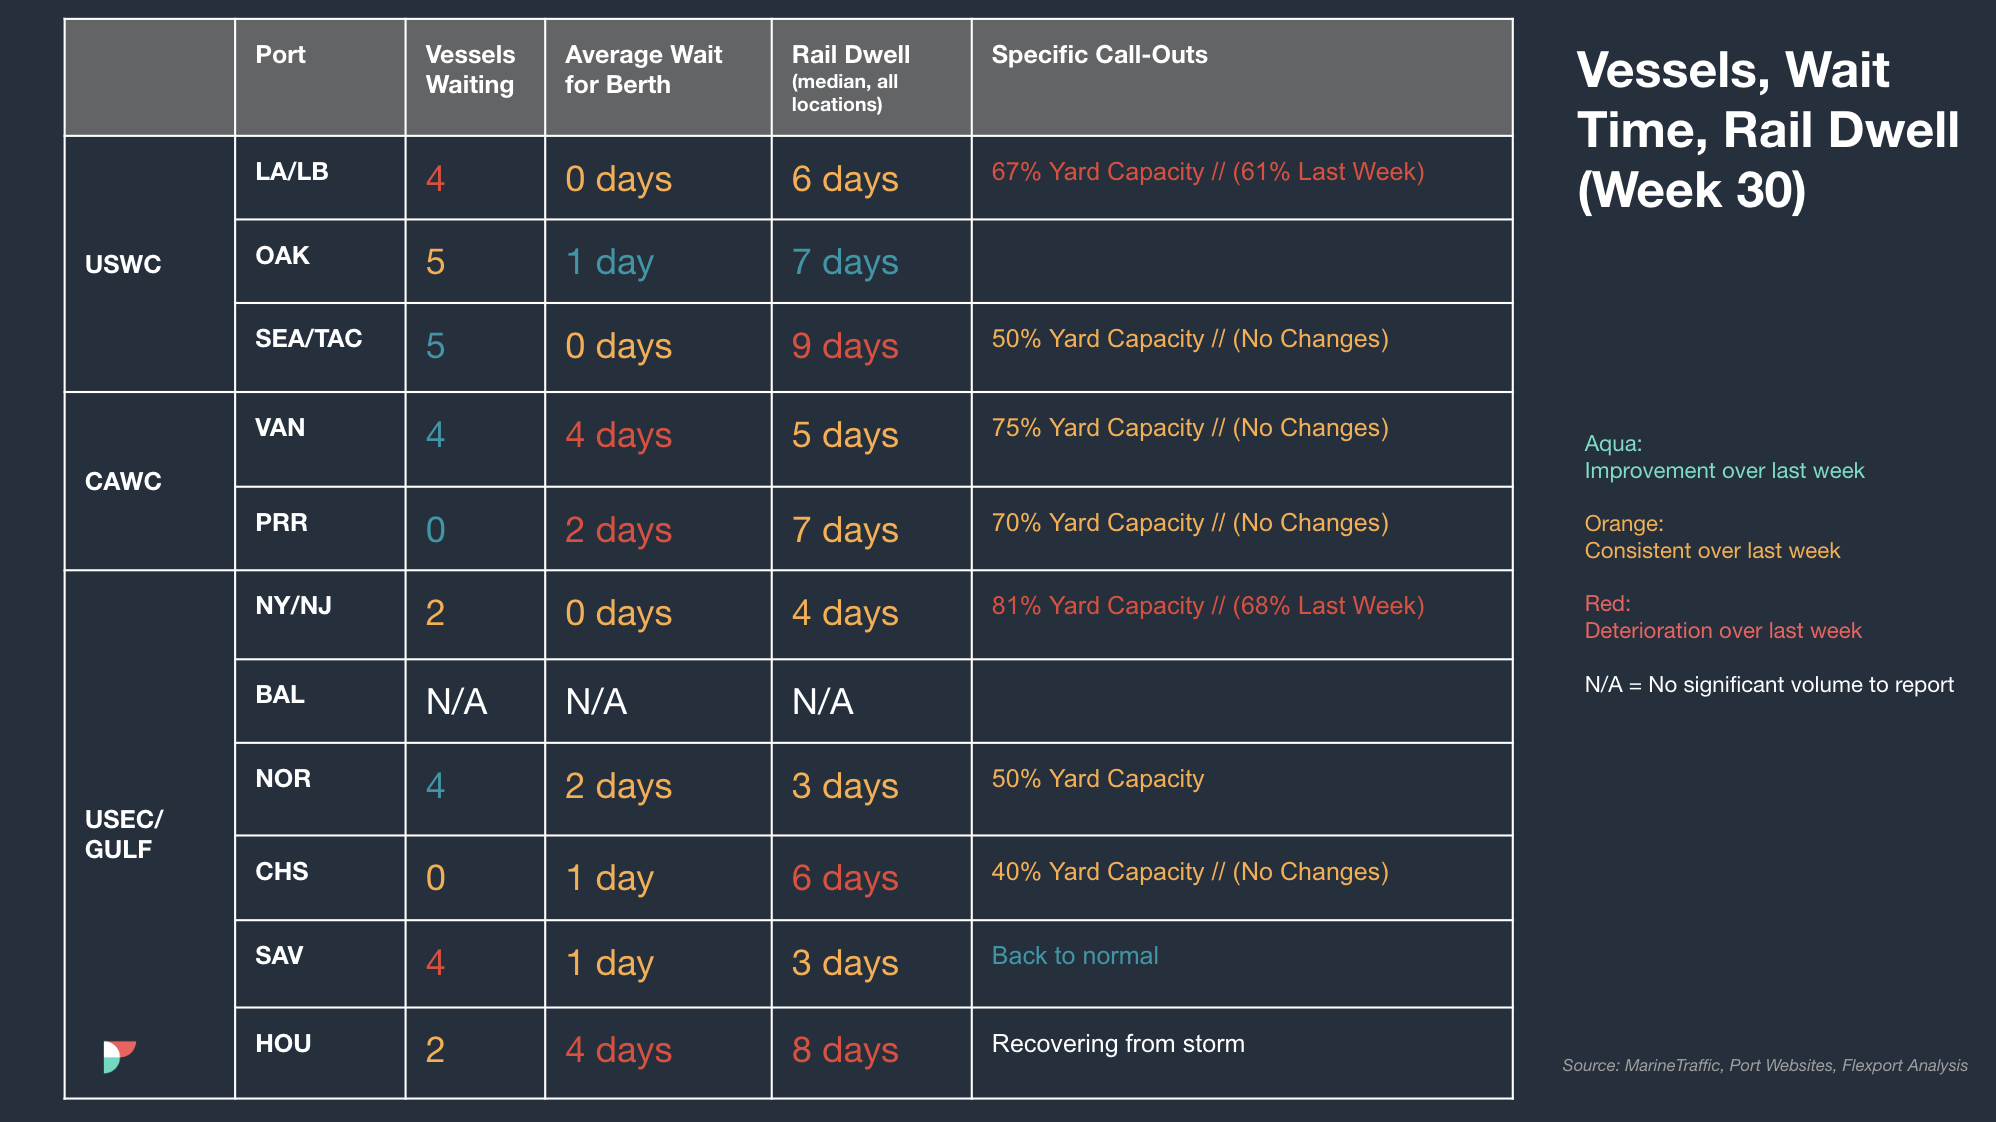
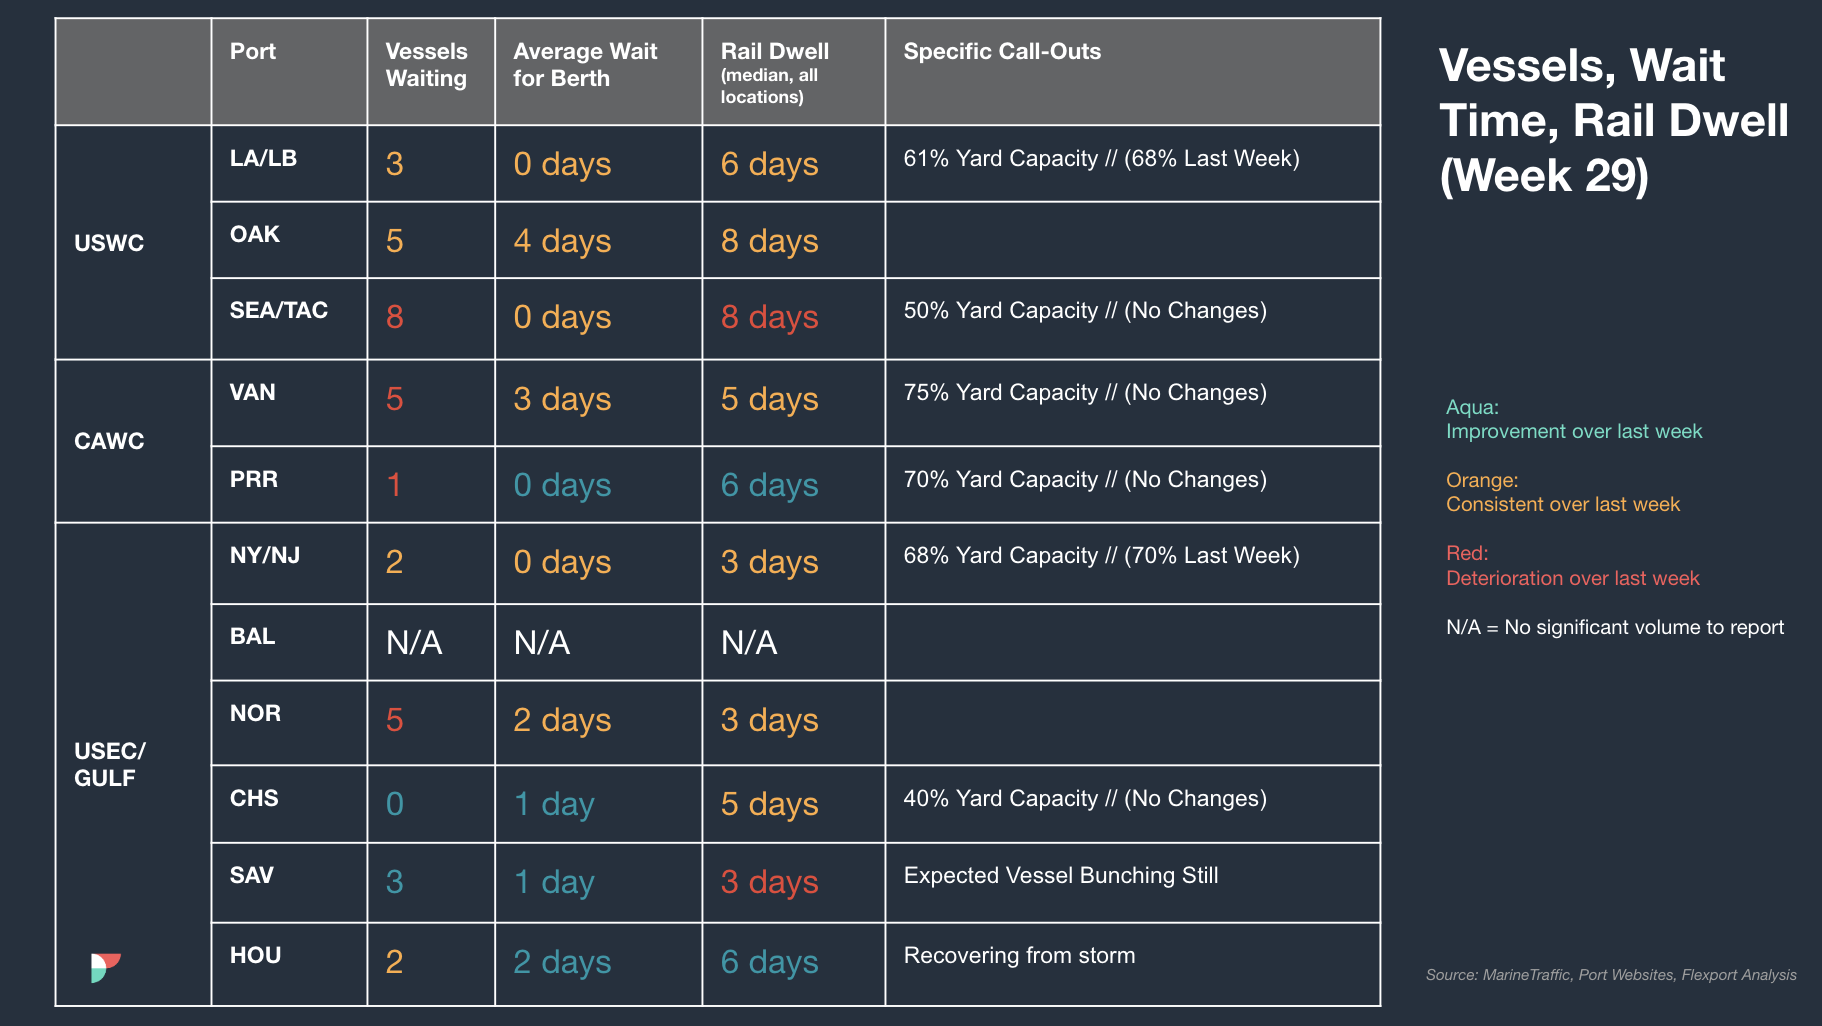
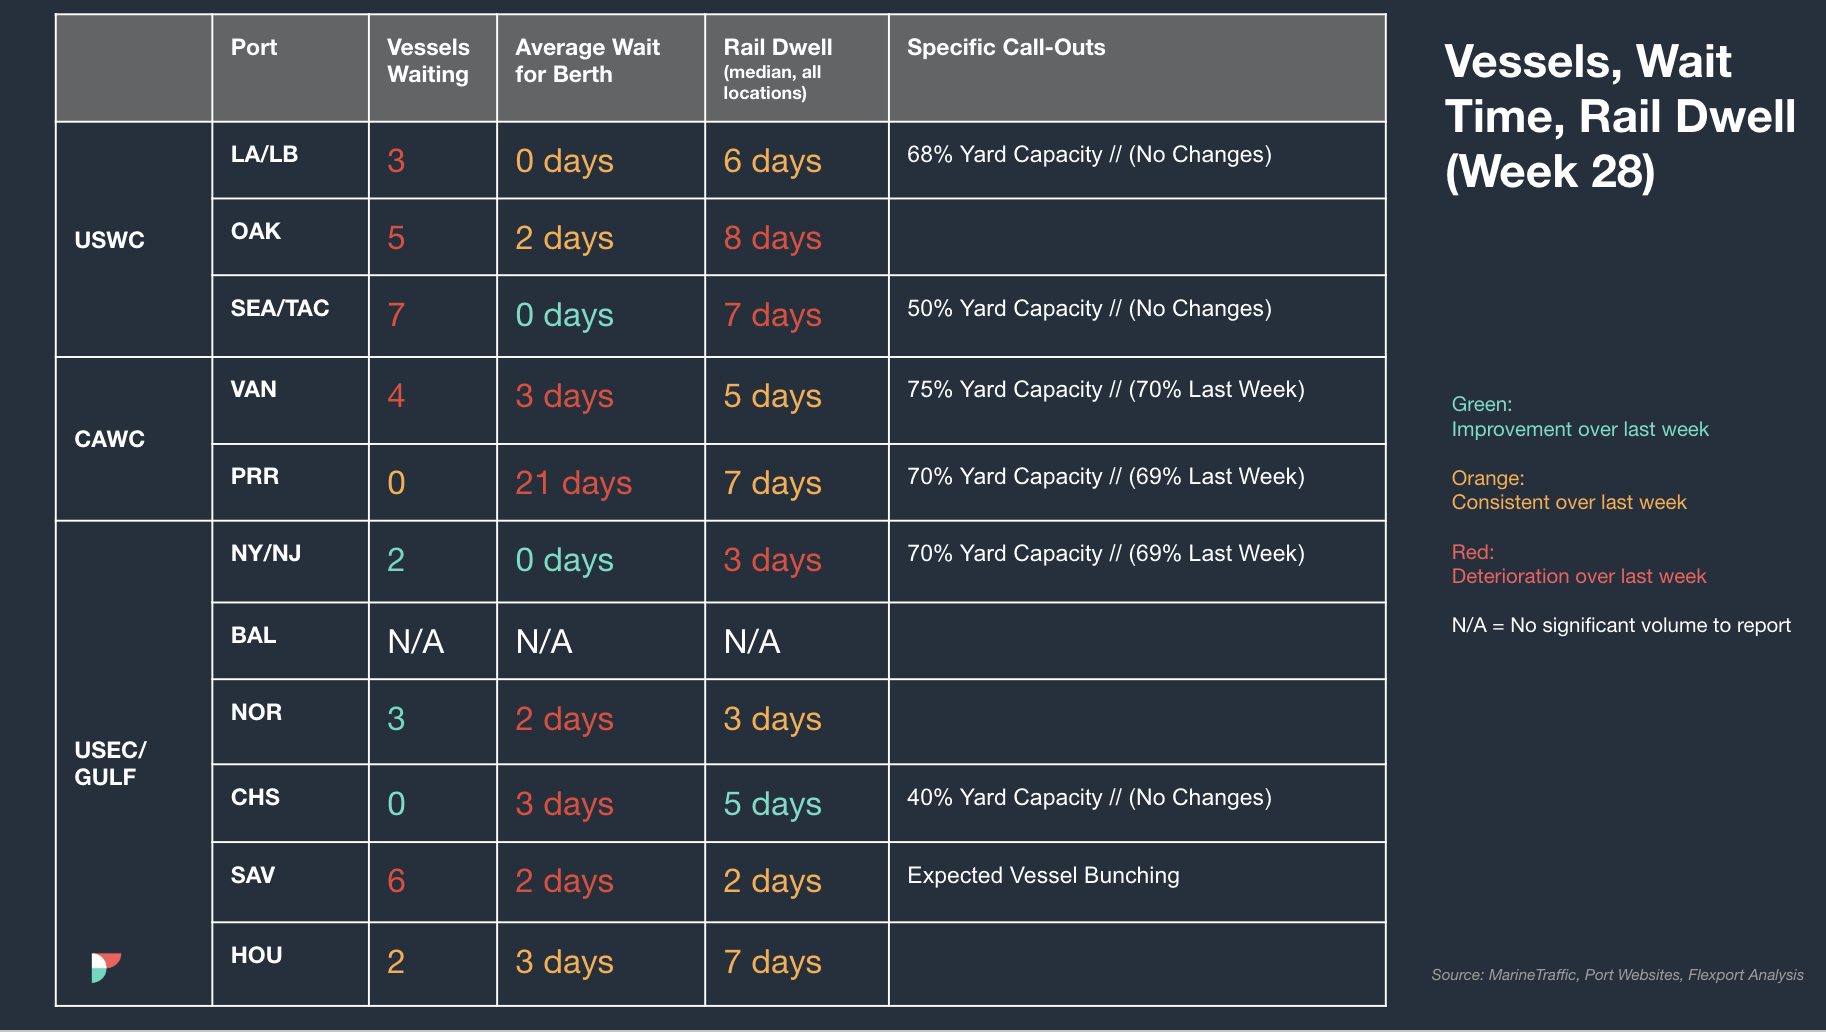
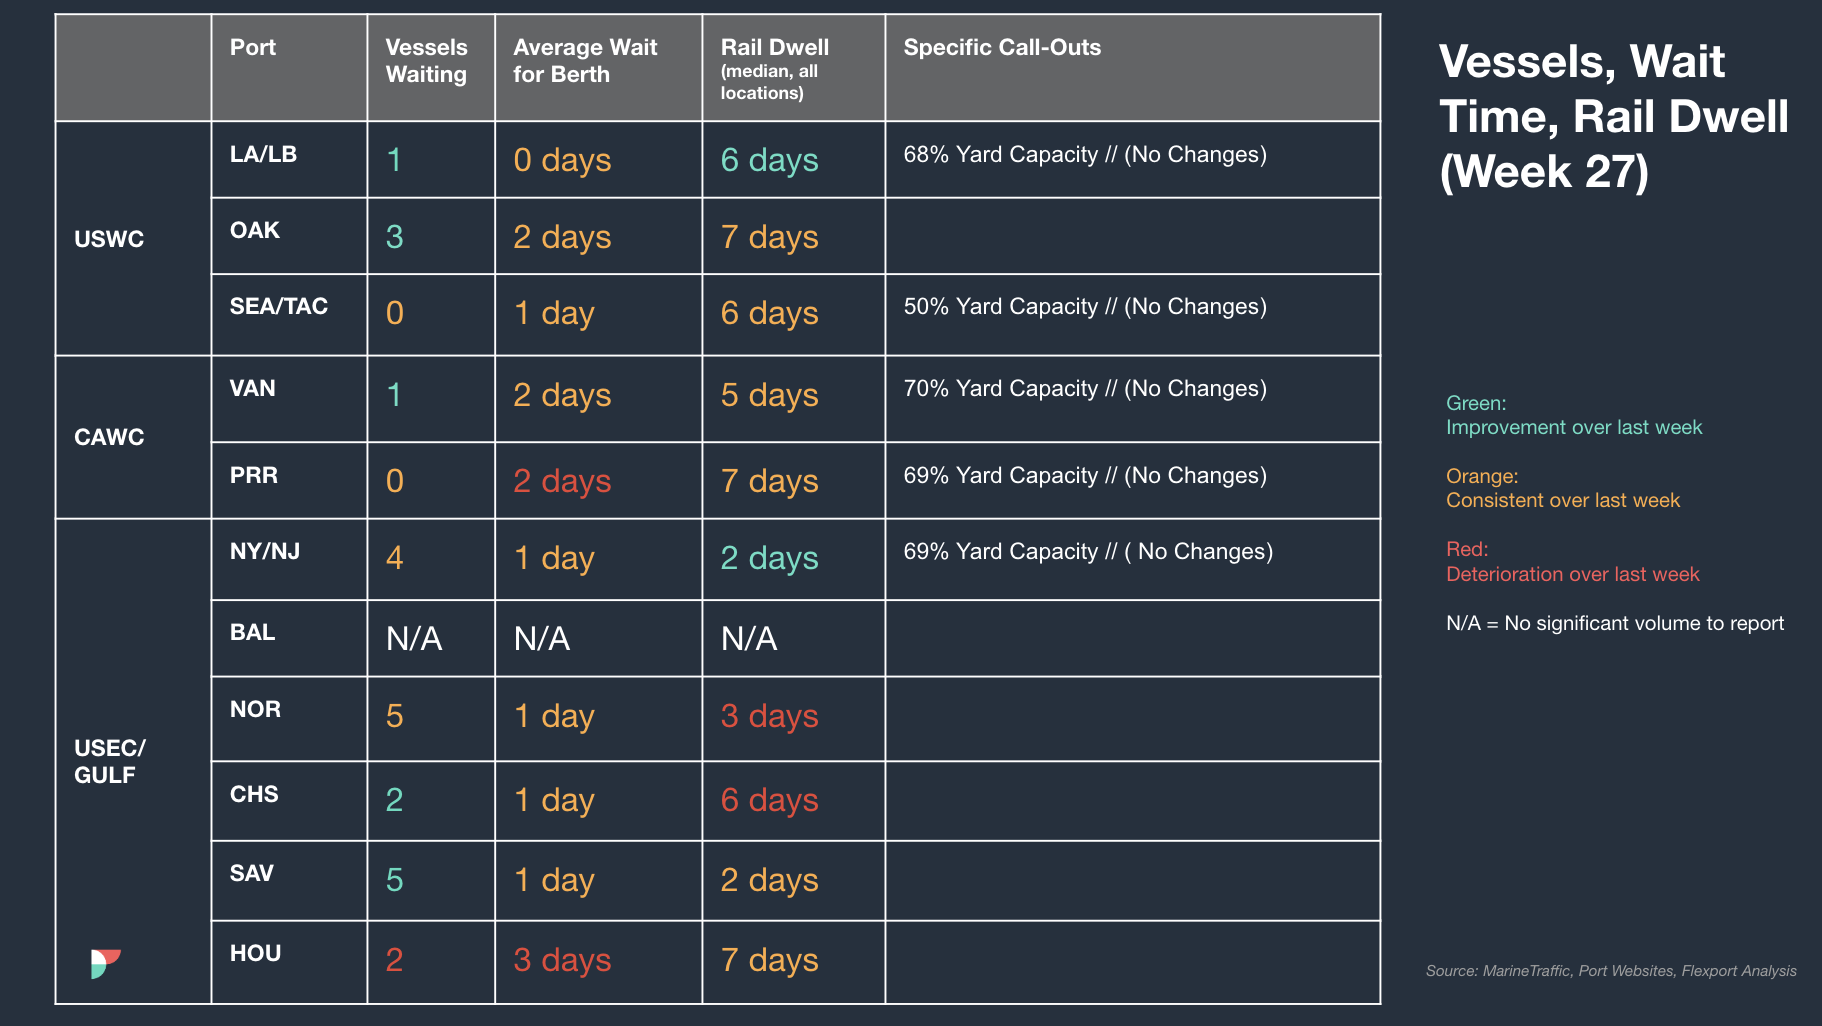
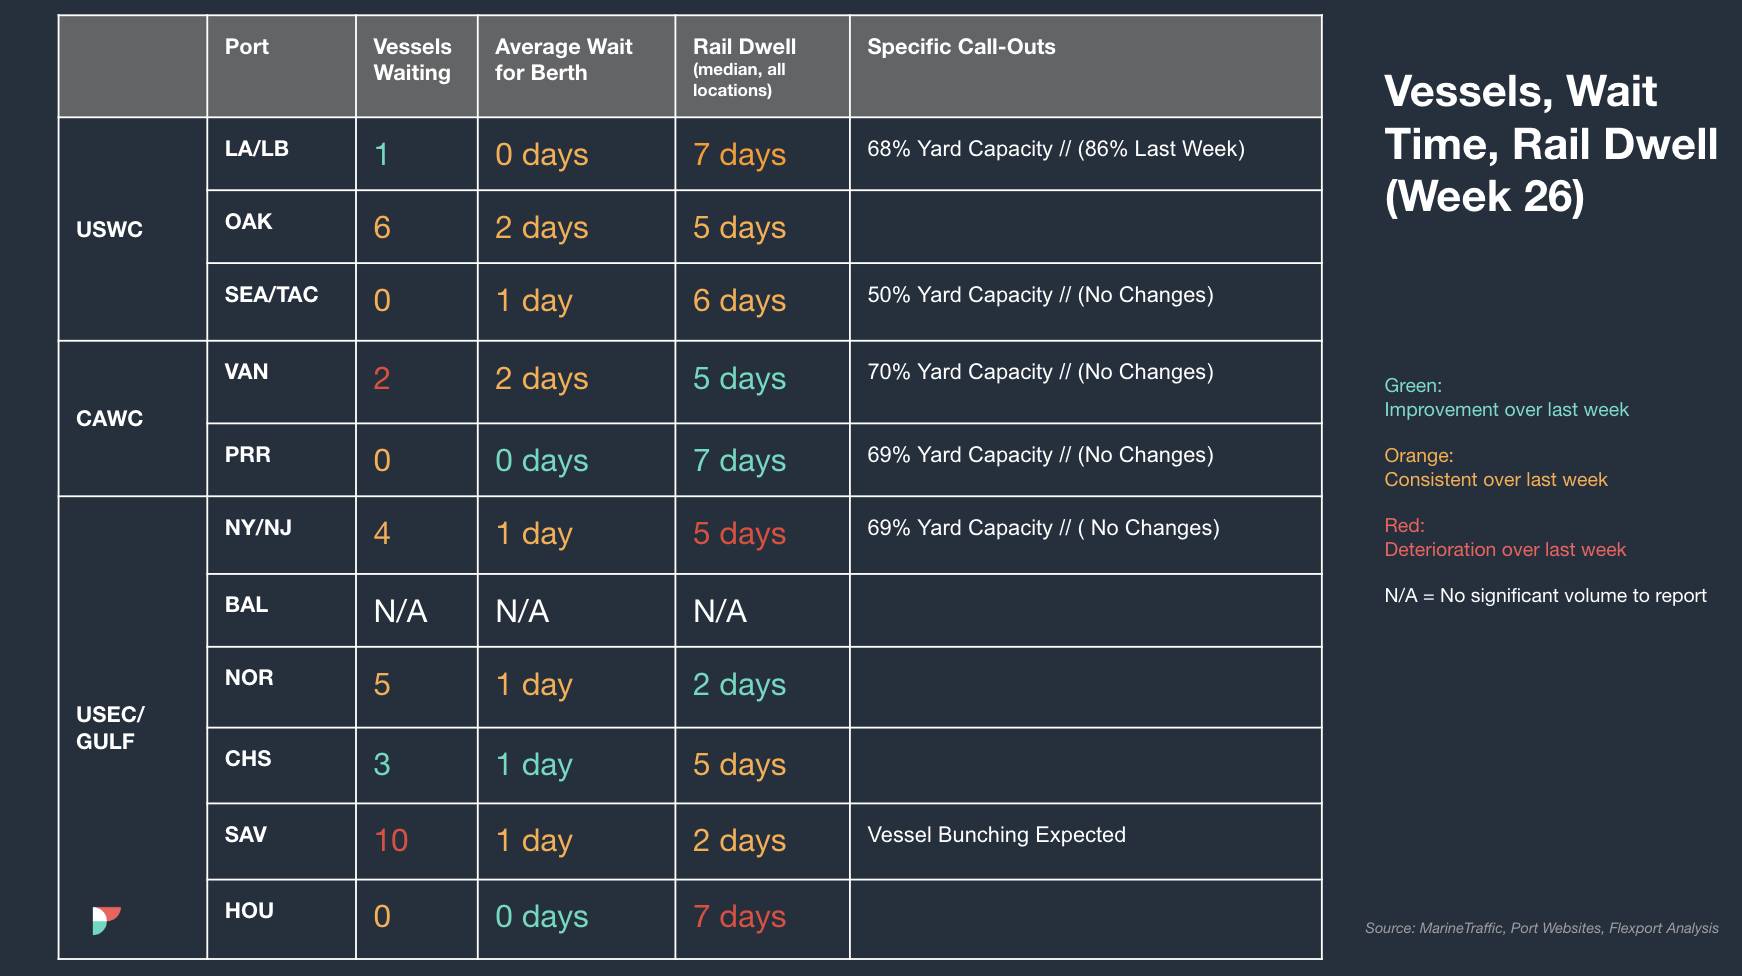
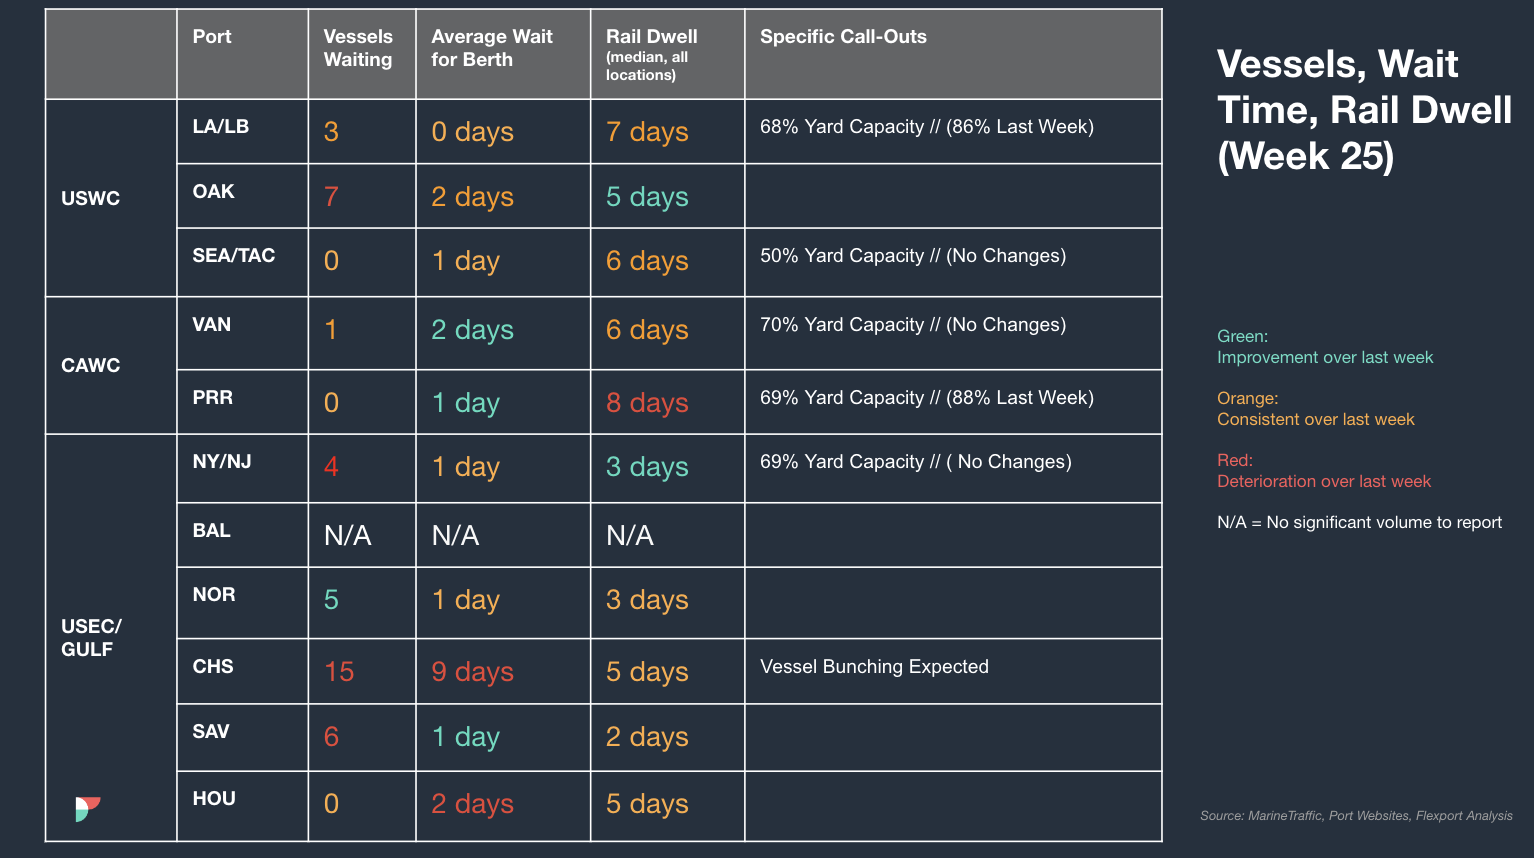
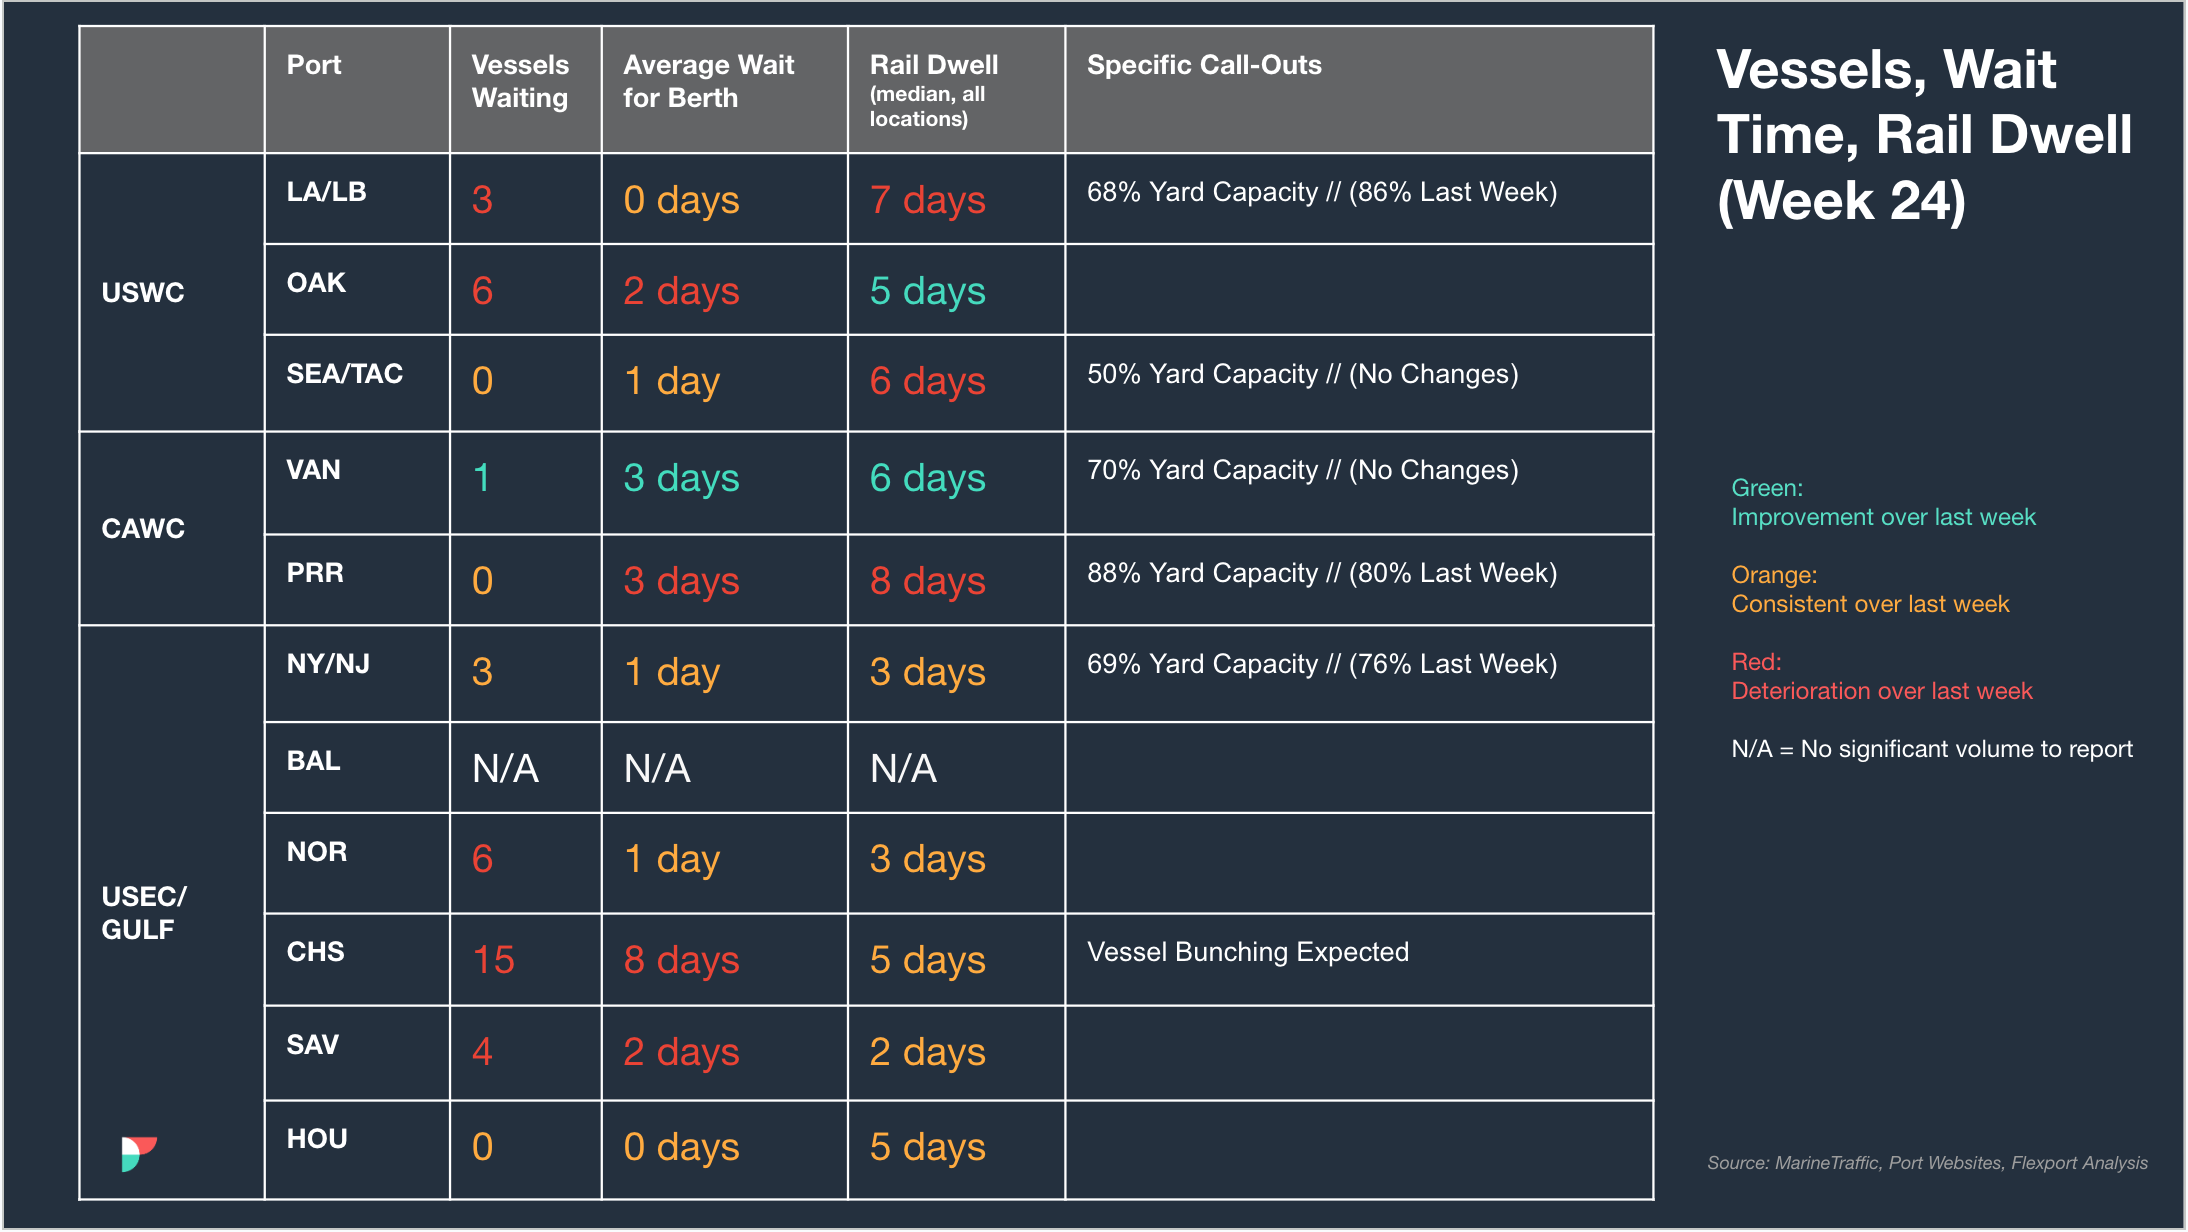
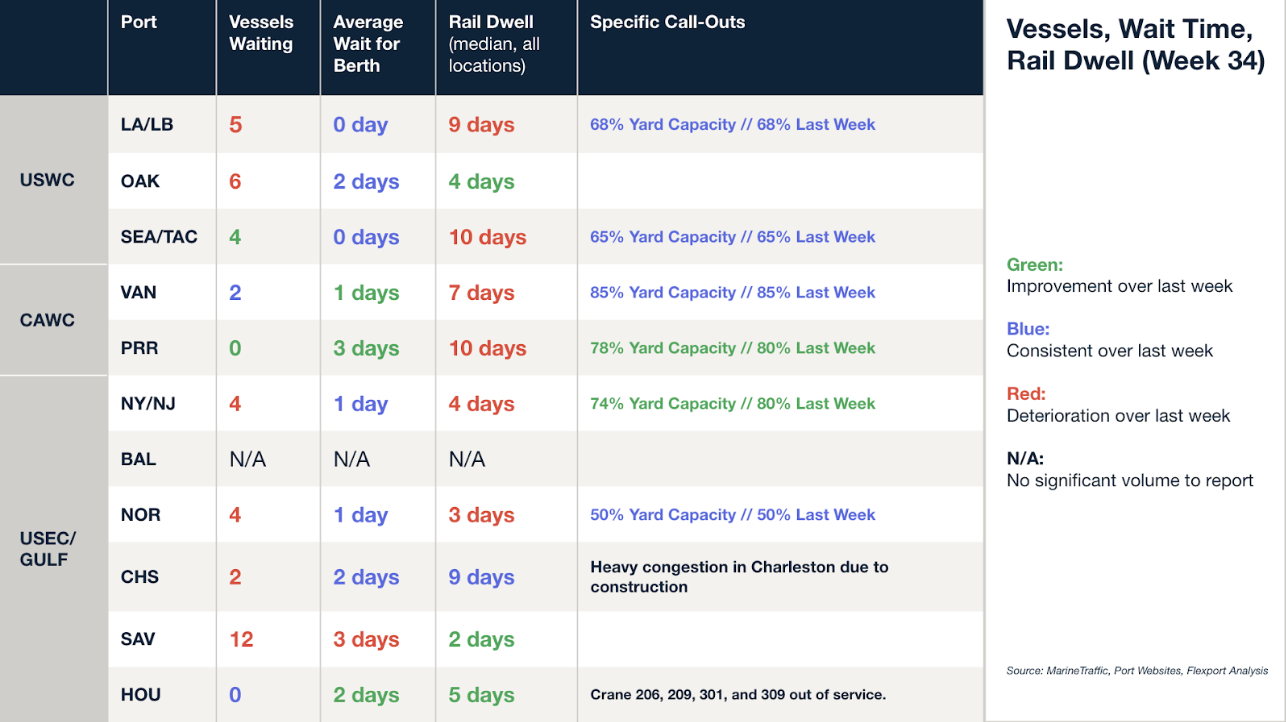
North America Vessel Dwell Times
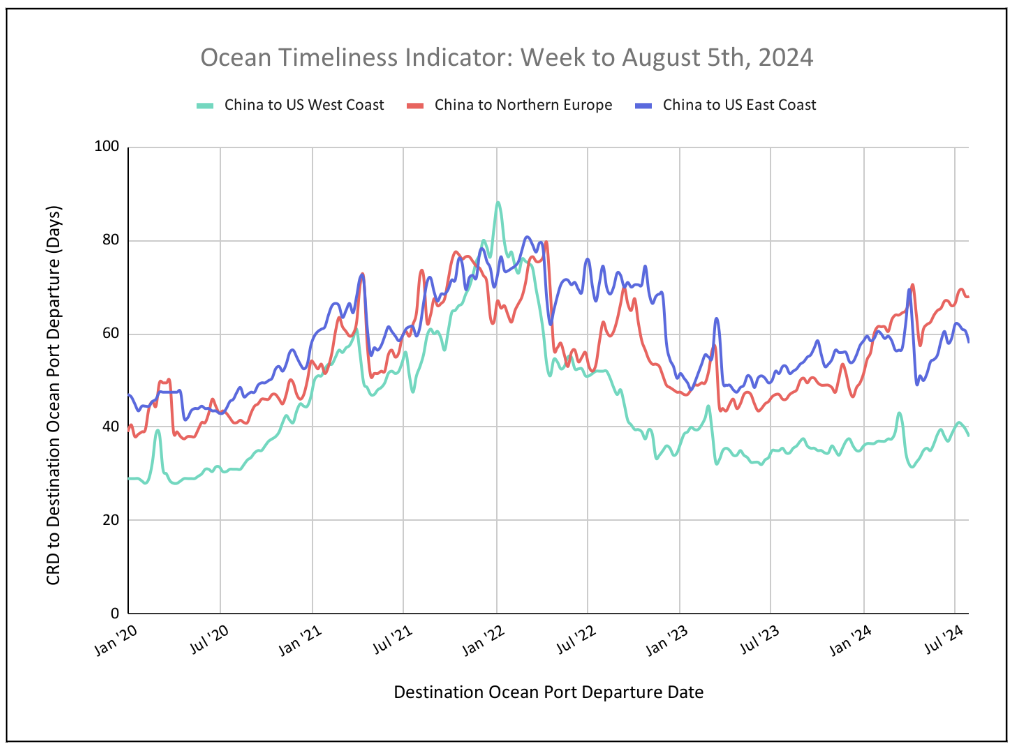
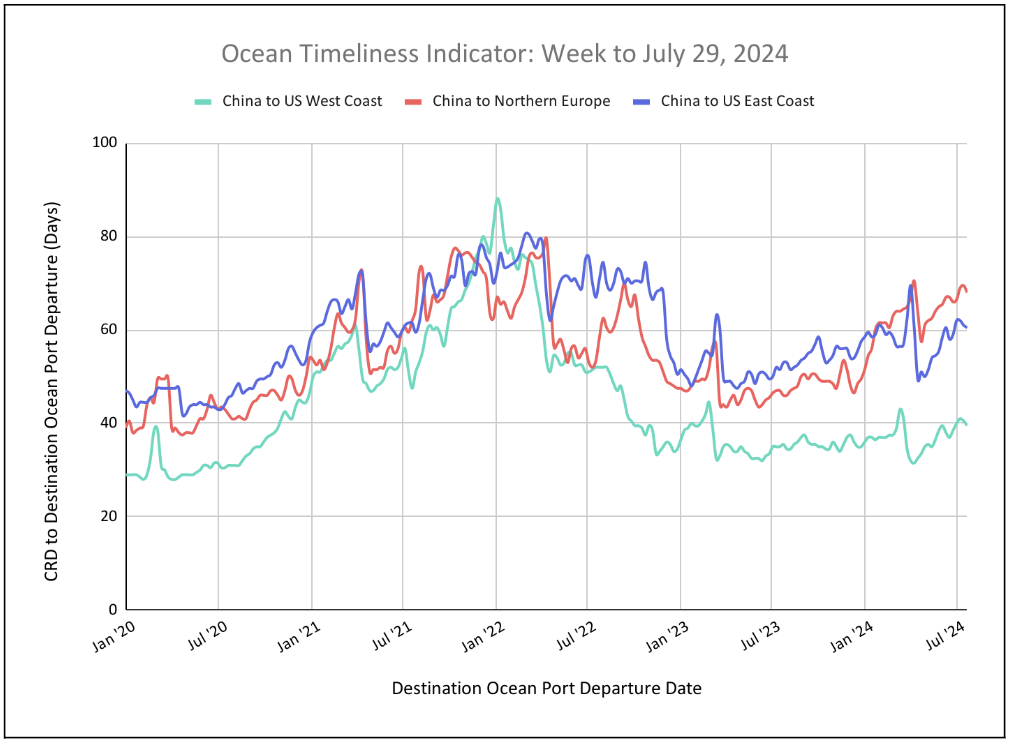
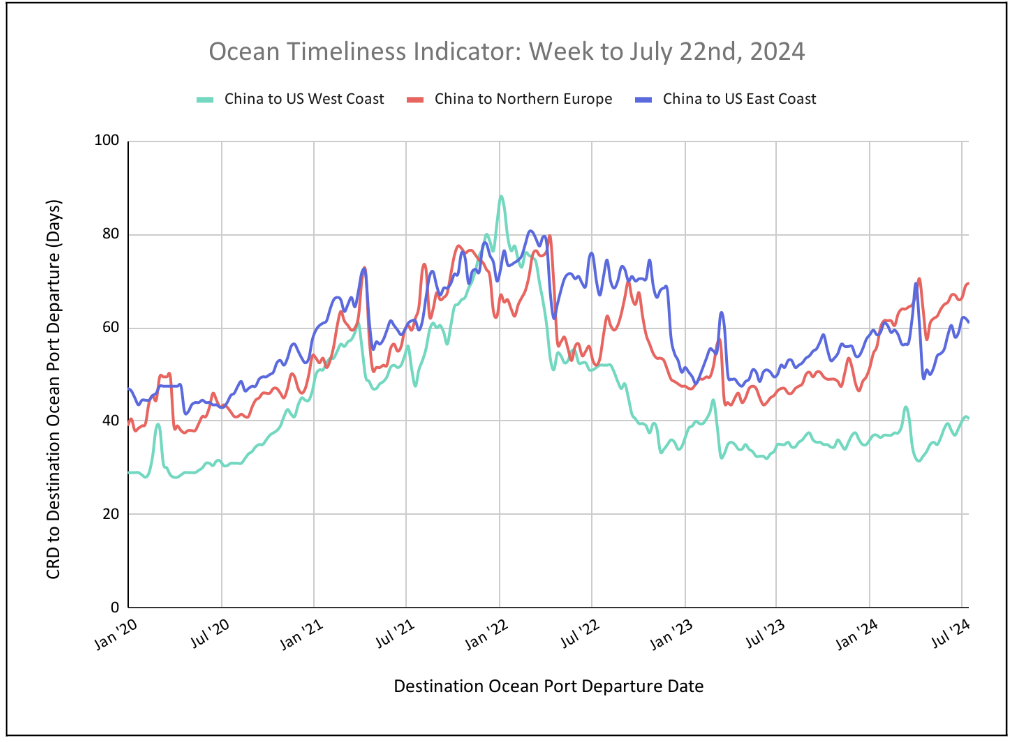
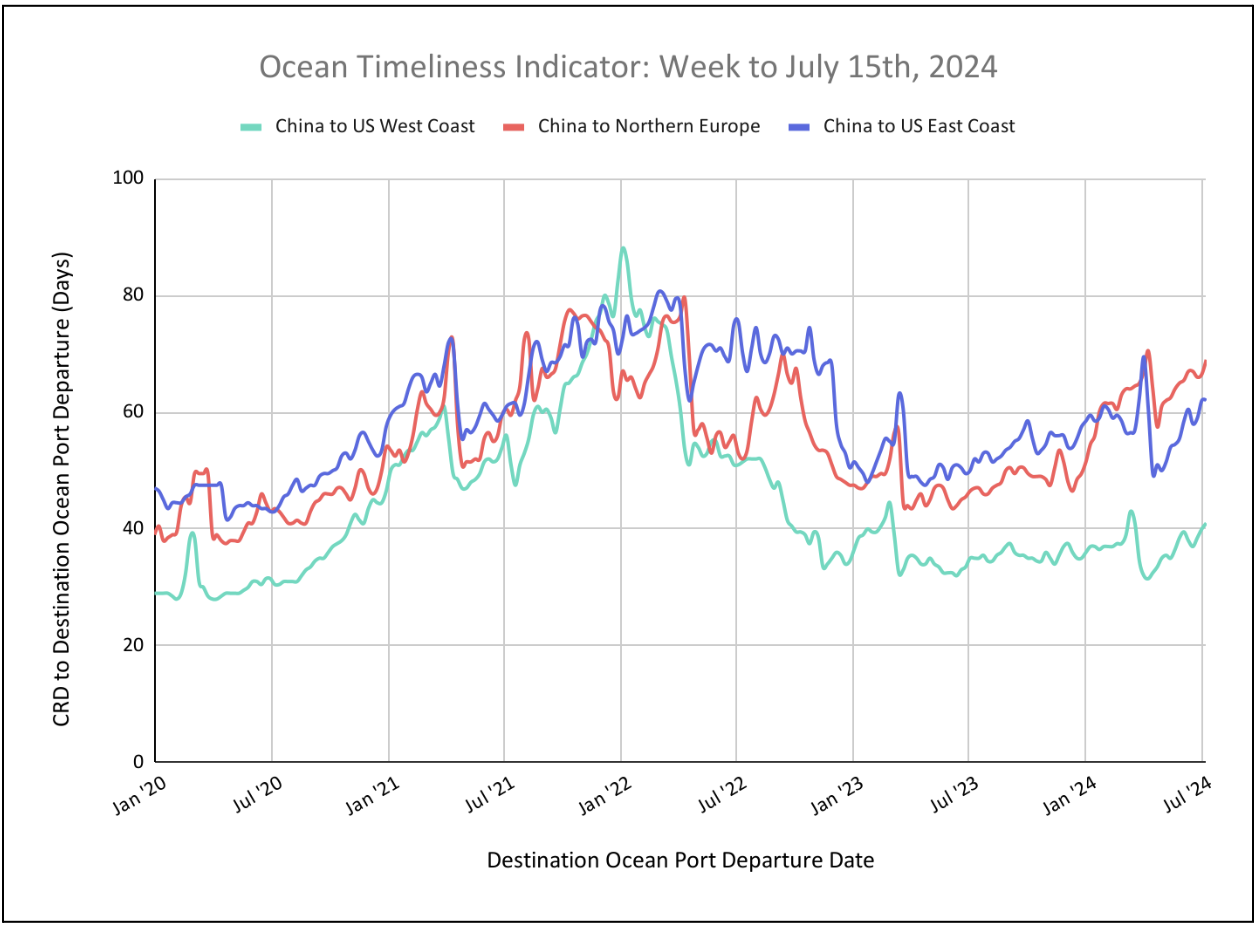
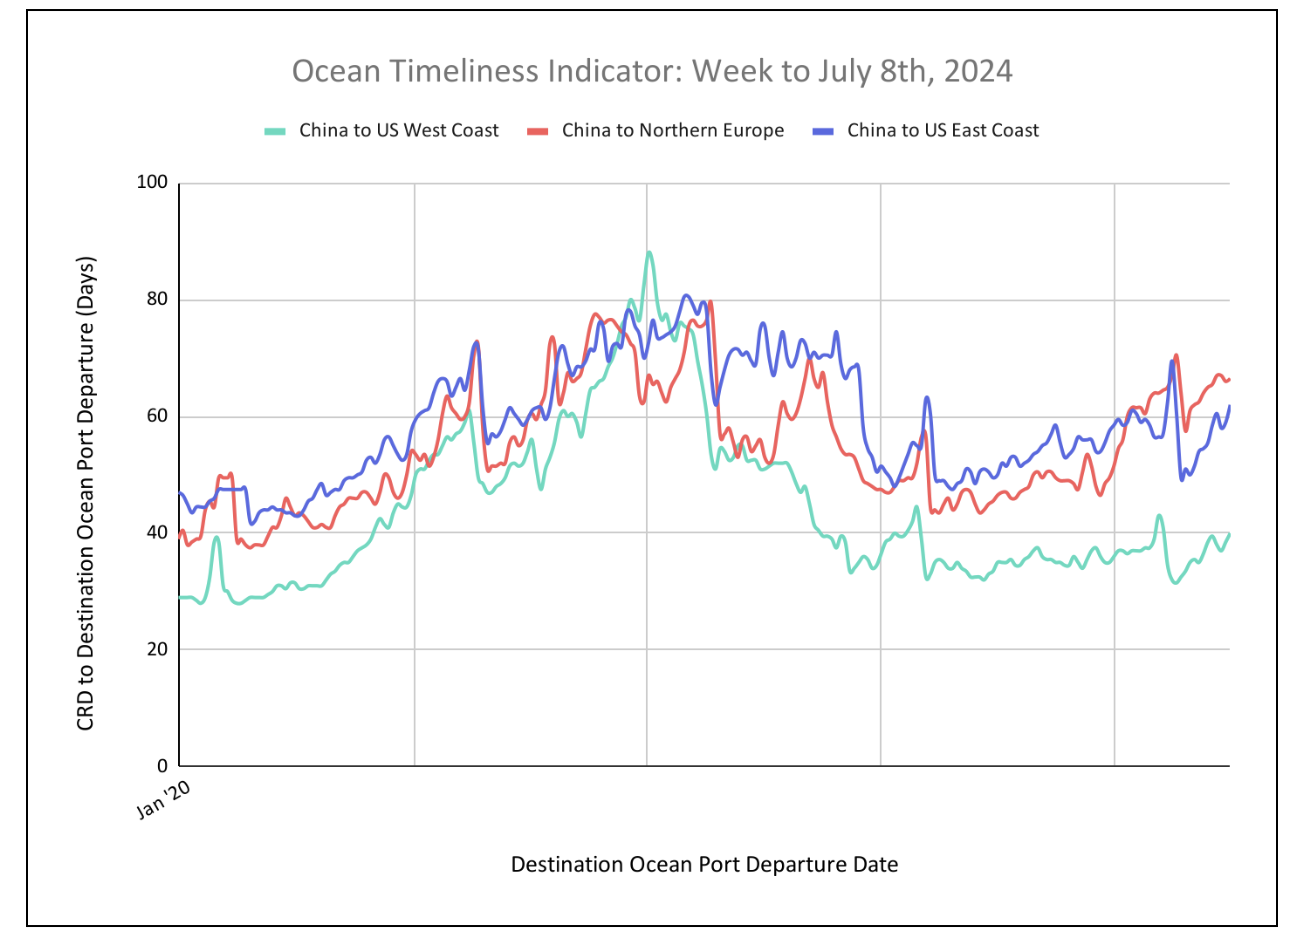
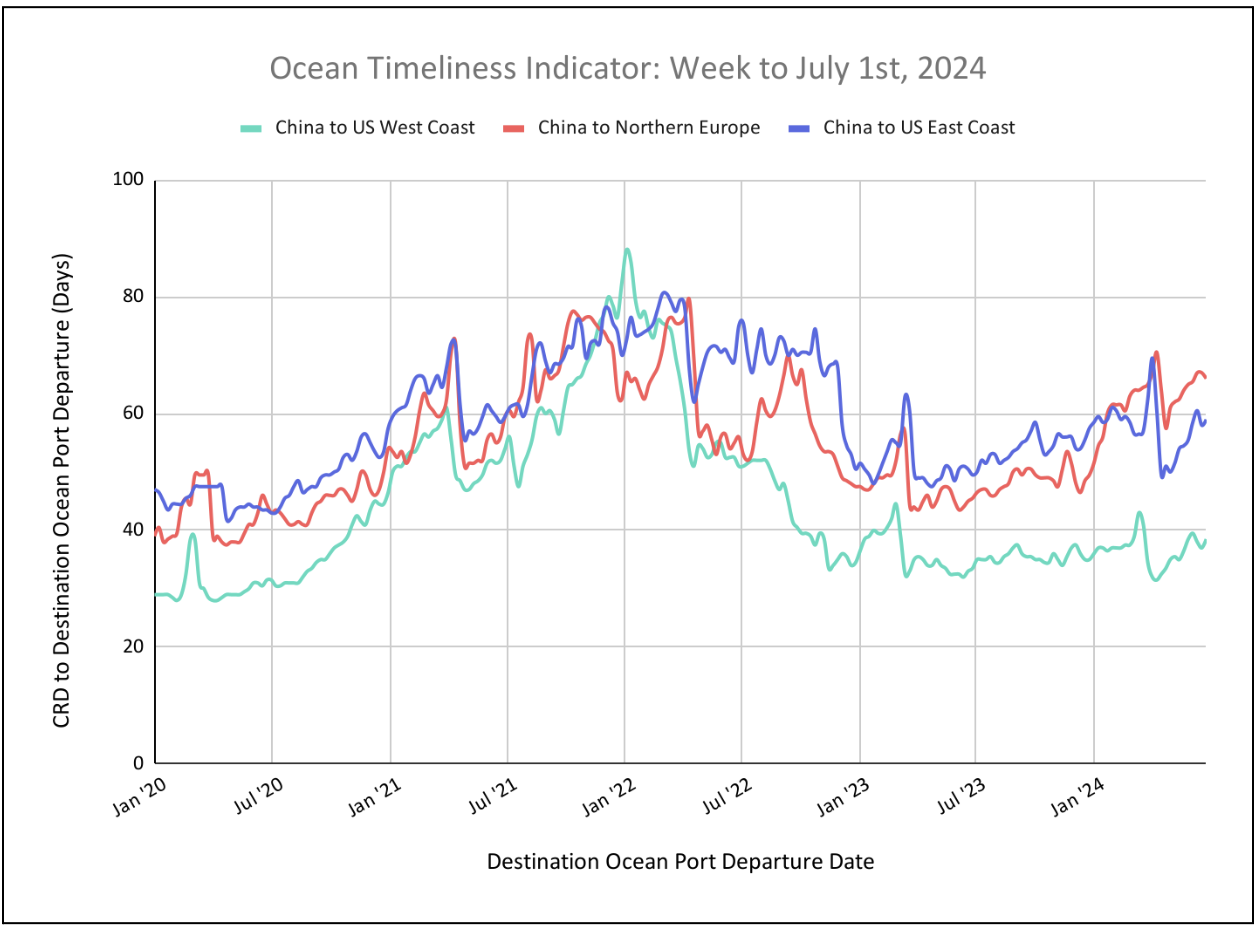
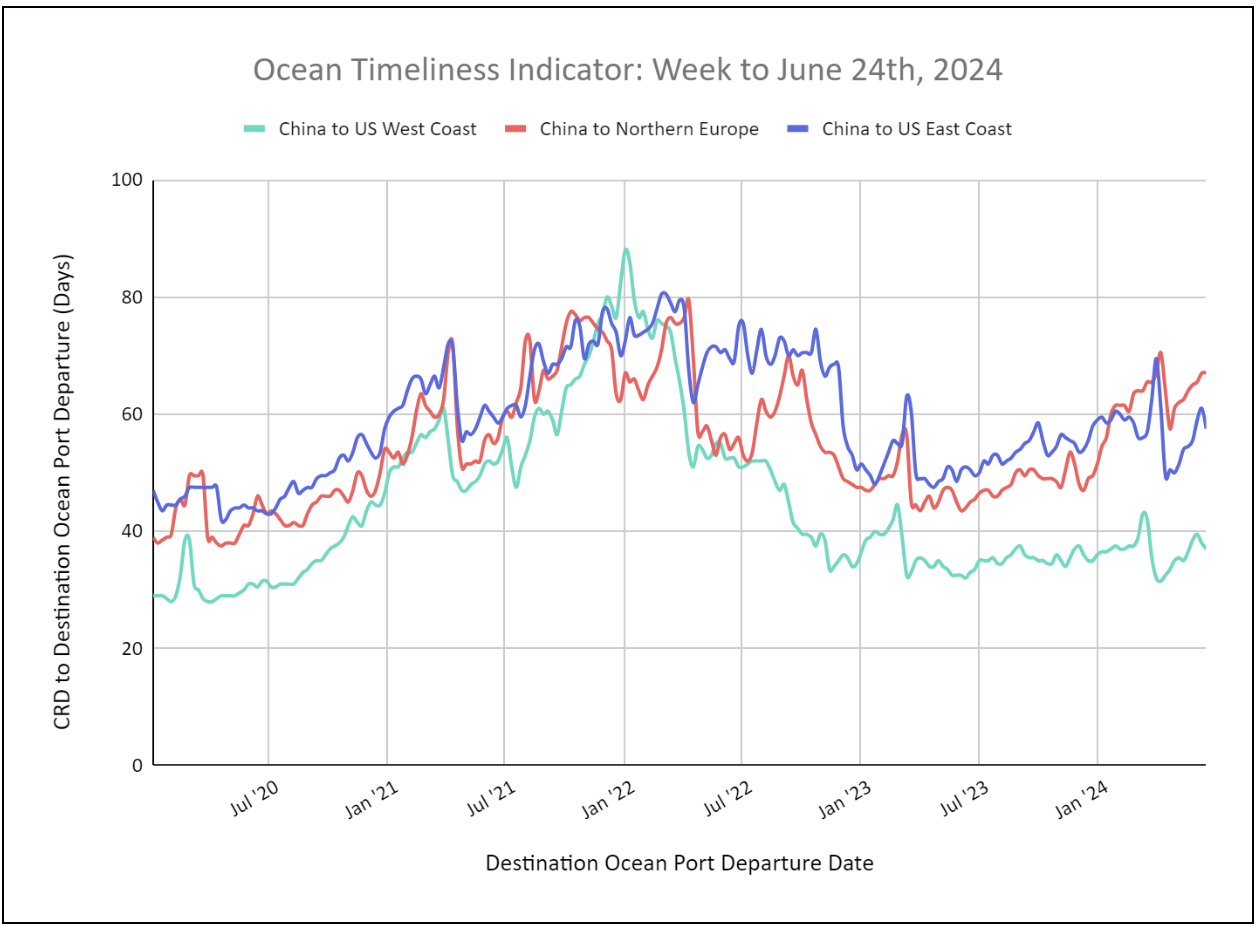
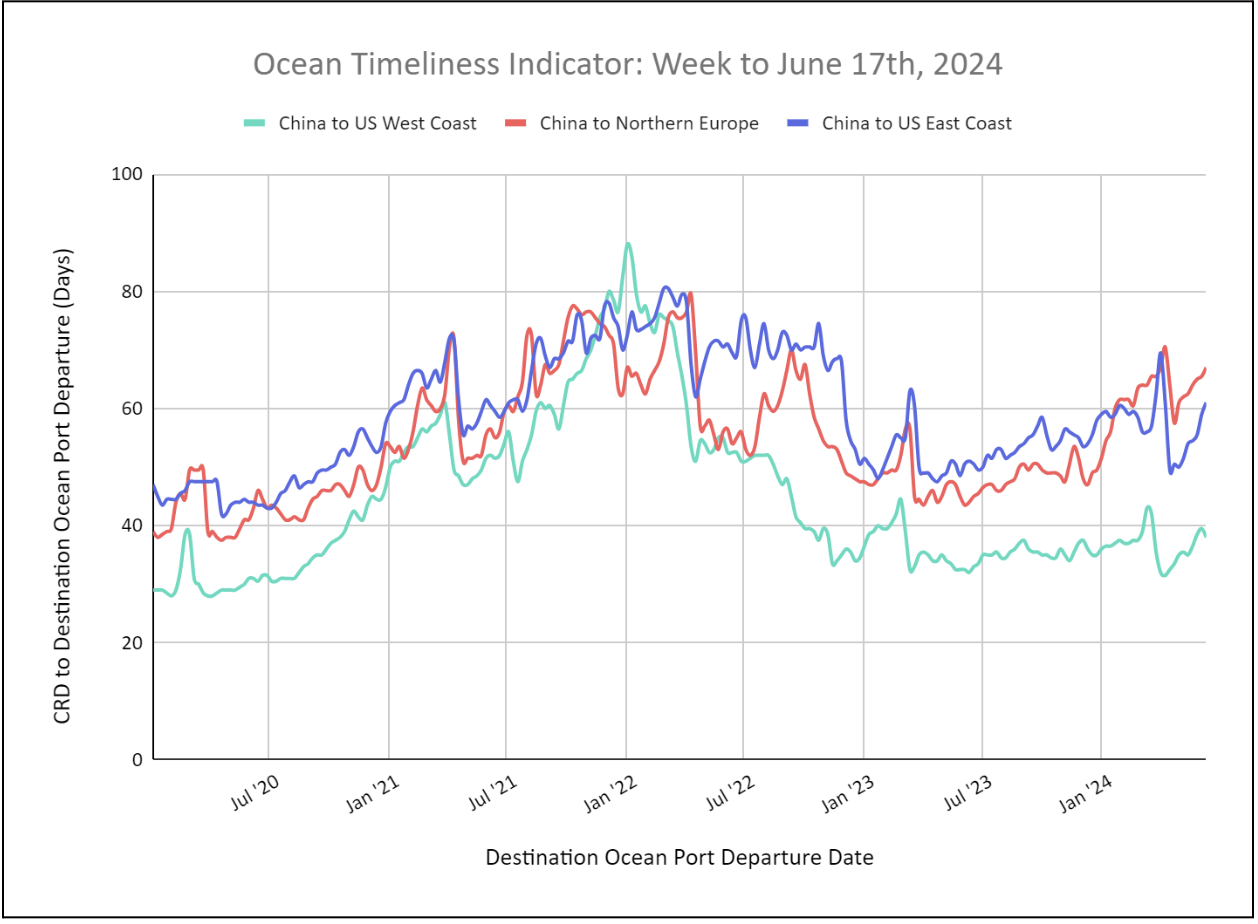
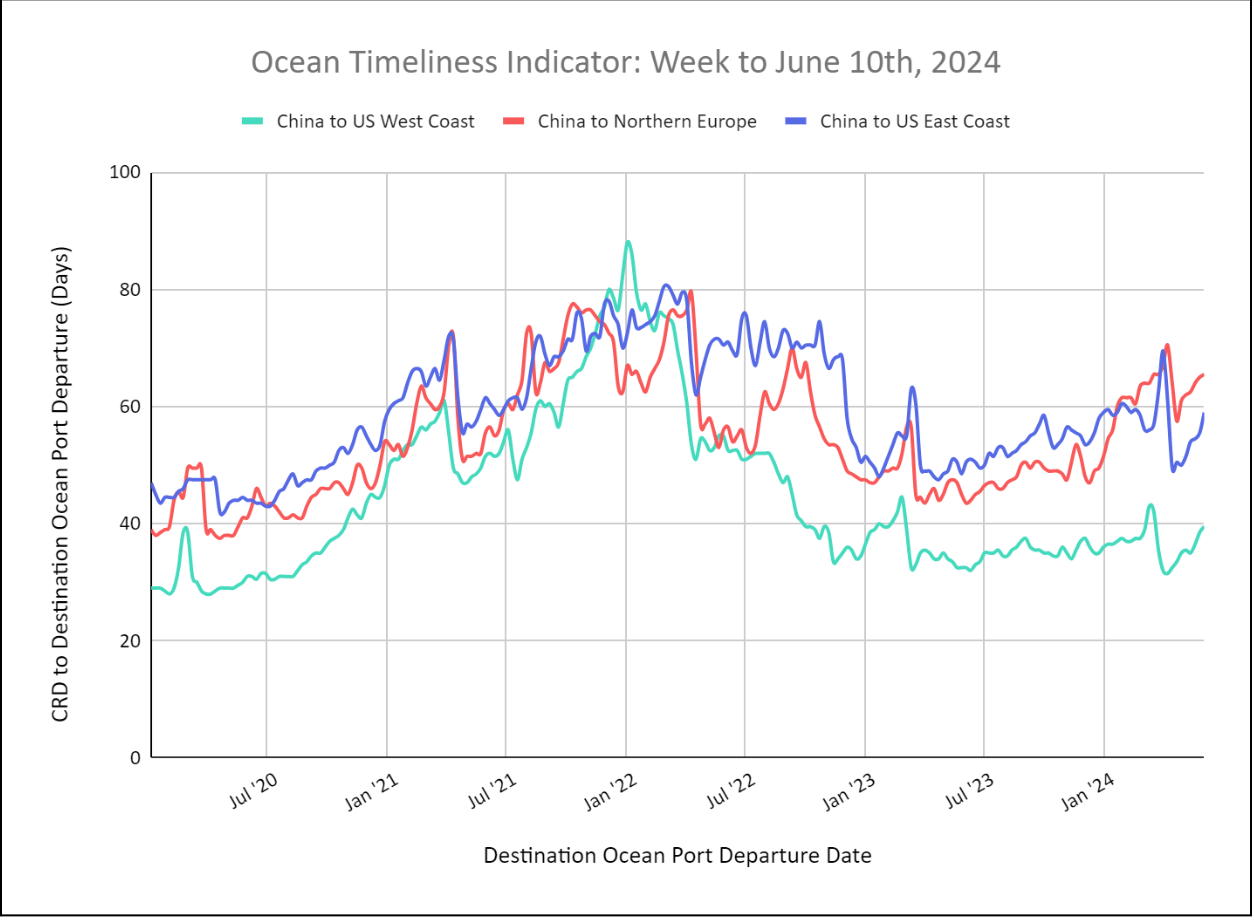
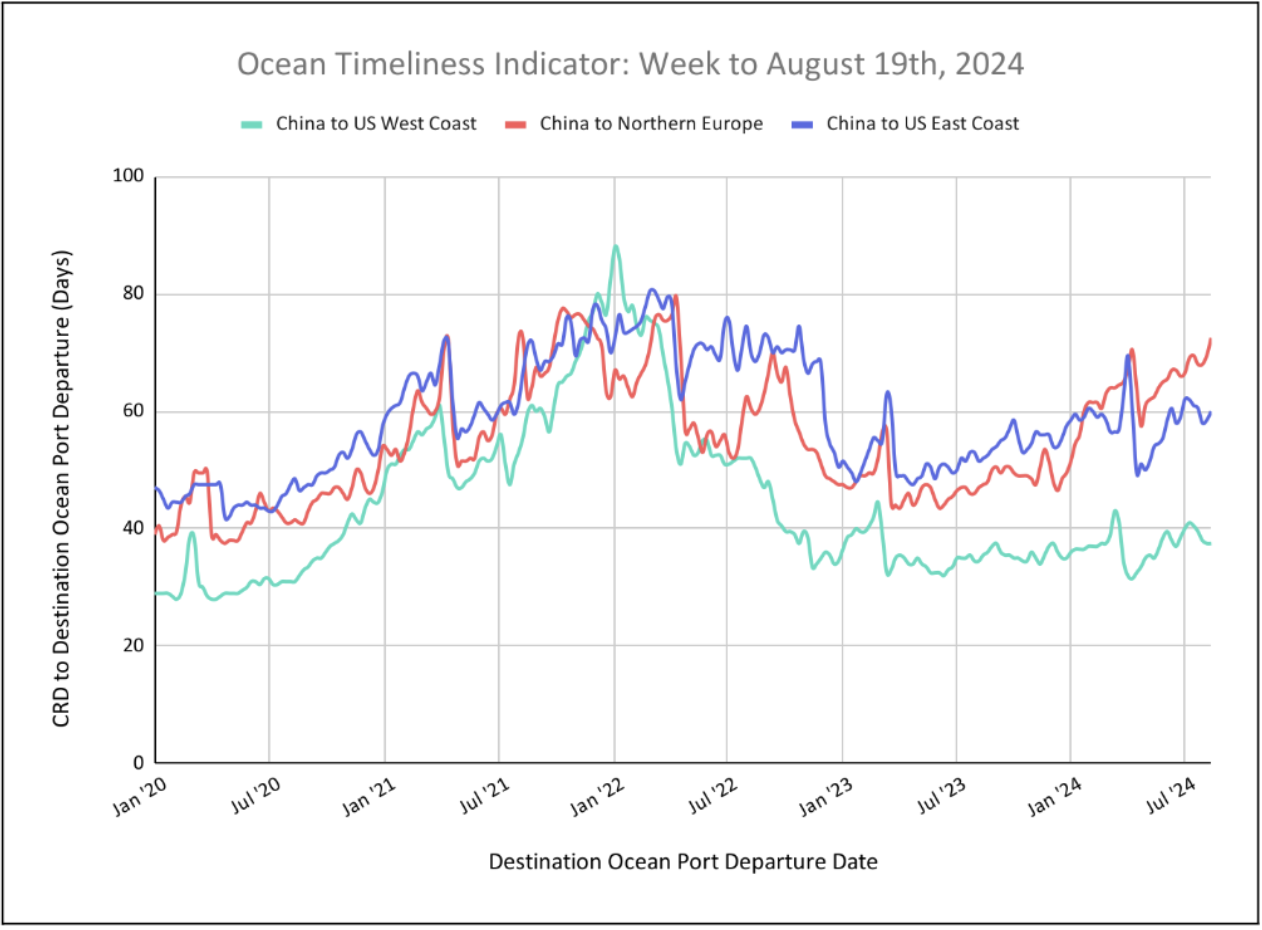
Flexport Ocean Timeliness Indicator
Ocean Timeliness Indicator plateaued for China to the U.S. West Coast, while China to the U.S. East Coast and China to Europe showed upticks.
Week to August 19, 2024
This week, the Ocean Timeliness Indicator showed a sudden uptick for both China to the U.S. East Coast and China to Northern Europe, increasing respectively from 58.5 to 60 days and 69.5 to 72.5 days. Meanwhile, China to the U.S. West Coast plateaued at 37.5 days.
Source from Flexport.com