Freight Market Update: April 4, 2024

Trends to Watch

[Ocean – FEWB]

  • Asia-Europe: The Red Sea situation continues to impact freight market development. Vessels continue rerouting via the Cape of Good Hope and vessel schedules continue fluctuating.
  • Demand remains flat but is picking up. The Economic Sentiment Indicator for the Eurozone in March stood at 96.3, surpassing both the previous value and market expectations. With Labor Day approaching, there will be a long holiday in Mainland China. Production may be impacted, so expect bookings to increase in late April and slow down in the first week of May.
  • General Rate Increases (GRI) were implemented by carriers to keep rates from dropping further. After a 9-week continuous drop, the latest Shanghai Containerized Freight Index (SCFI) increased by $51/TEU for week 14. Most of the carriers successfully pushed for a GRI in the 1st half of April. With most vessels projected to be full, expect another round of GRI for the 2nd half of April, as there are around 2 million TEU of new capacity for delivery in the coming months. Most of the capacities are mega ships where Asia-Europe trade will be the primary option. Expect GRI to be on and off in the coming months until all new ships are available.

[Air – Global] (Data Source: WorldACD/Accenture)

  • Air cargo rates have increased globally, particularly from Asia Pacific and Middle East & South Asia (MESA), driven by disruptions in container shipping and a high demand for cross-border e-commerce shipments, with average global rates up by around +3% in week 12 to $2.45.
  • Despite a slight decrease in global tonnages (-2%) in week 12 compared to the previous week, there was a +1% increase in tonnages and a +6% increase in average rates over the last two weeks compared to the prior period, with notable rate increases from MESA (+10%) and Asia Pacific (+7%).
  • Year-on-year data shows significant improvements in demand, with global tonnages up by +8%, led by rises from MESA (+15%) and Asia Pacific (+12%), amid continued disruptions in Asia-Europe container shipping and strong e-commerce demand.
  • Air cargo capacity has significantly increased over the last year (+9% globally), especially from Asia Pacific (+19%) and Central & South America (+12%), while average rates remain above pre-COVID levels, despite a year-on-year decrease.
  • Notable regional highlights include a surge in demand and rates from MESA, with YoY tonnage up +15% and rates up +29% in weeks 11 and 12, and significant increases in air freight traffic from the Eastern Mediterranean to MESA due to container shipping disruptions, with Athens and Istanbul experiencing notable growth in tonnages to Dubai.

Please reach out to your account representative for details on any impacts to your shipments.

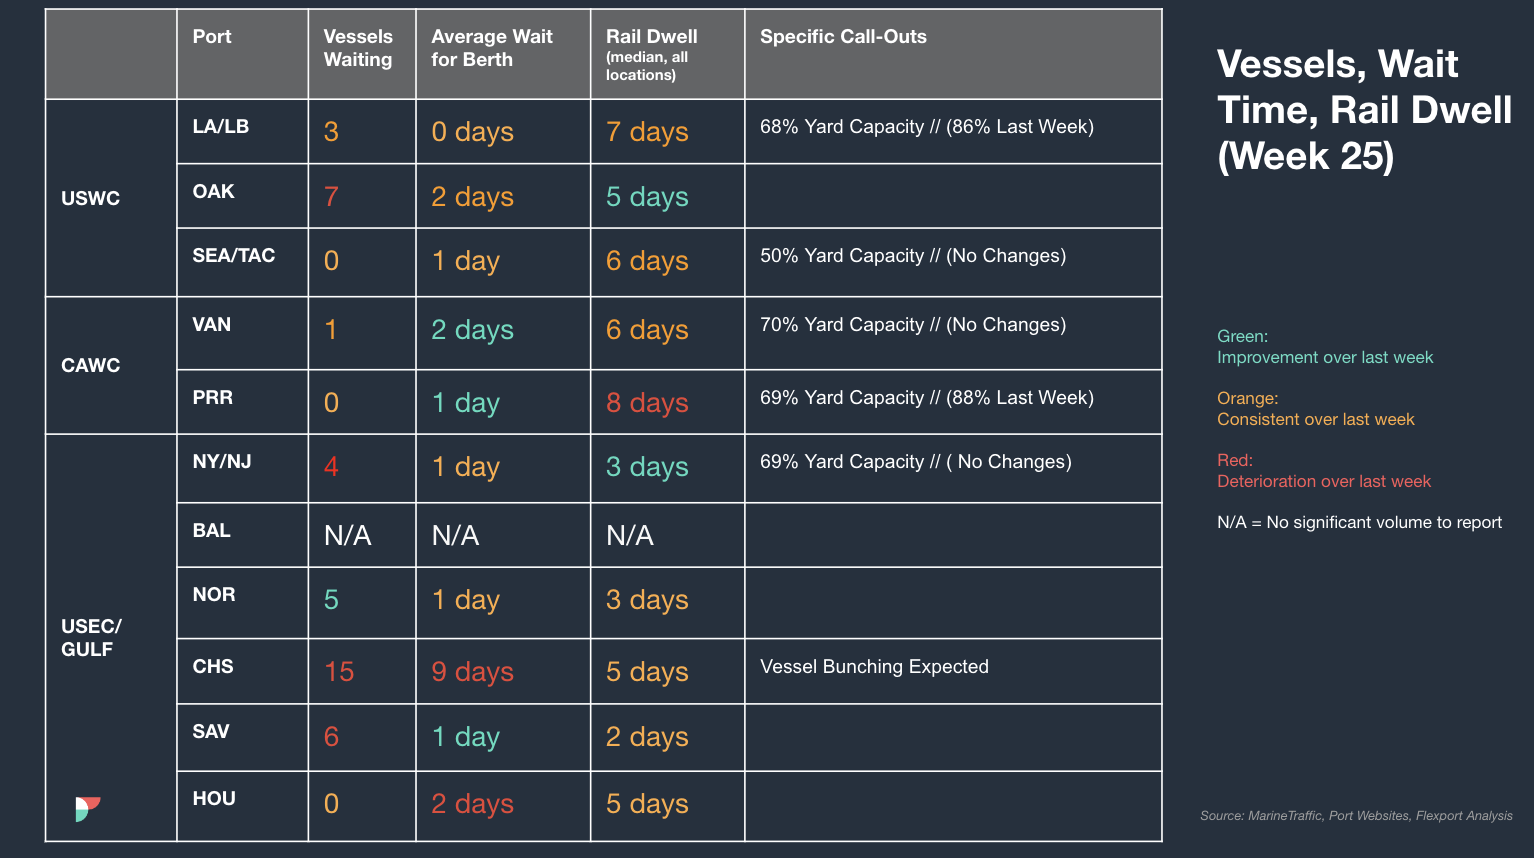
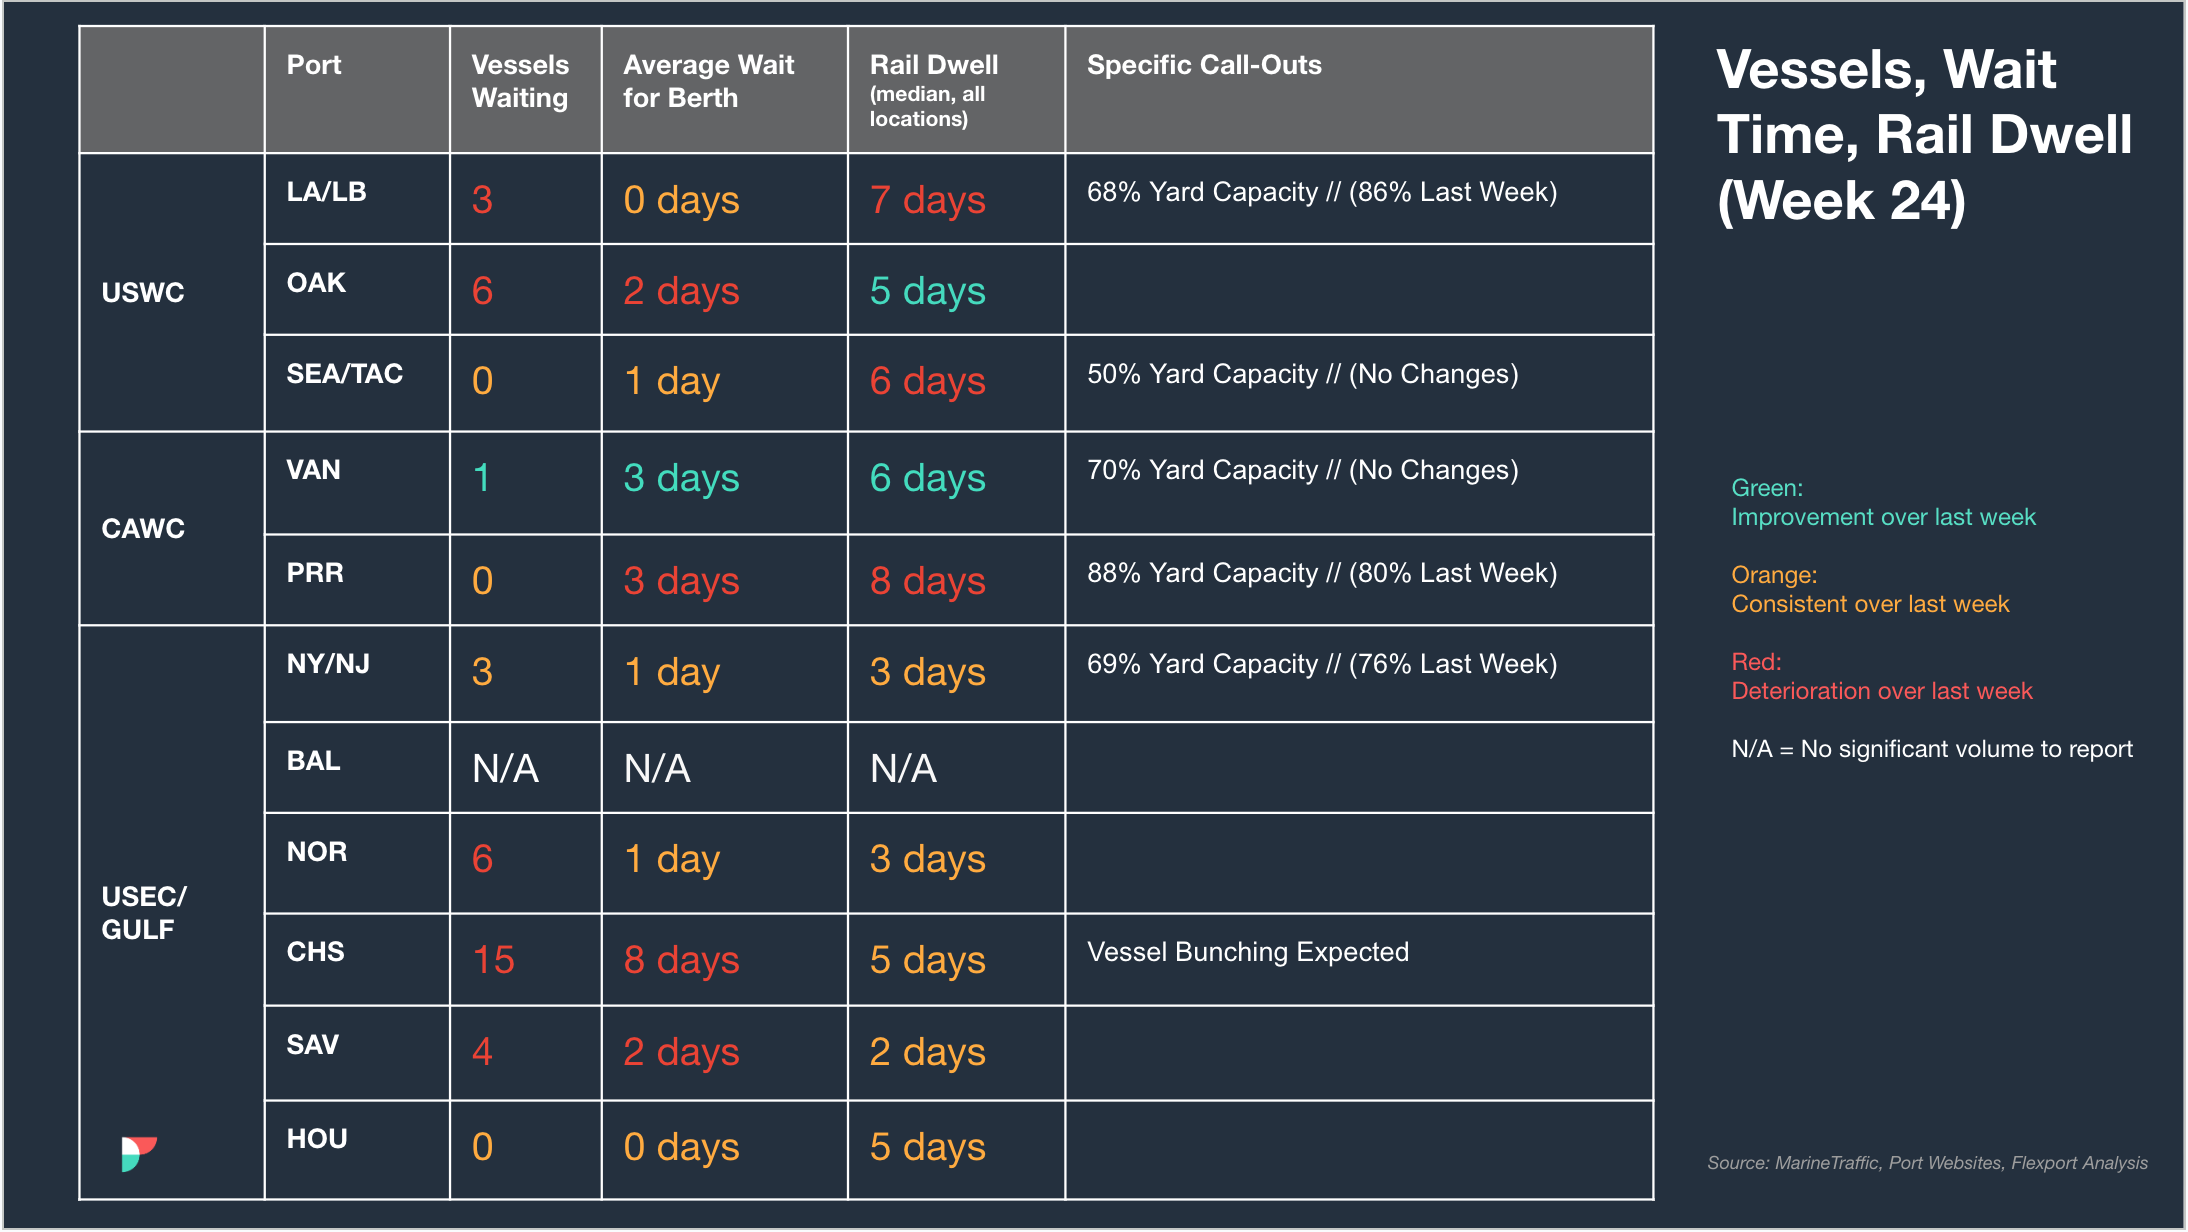
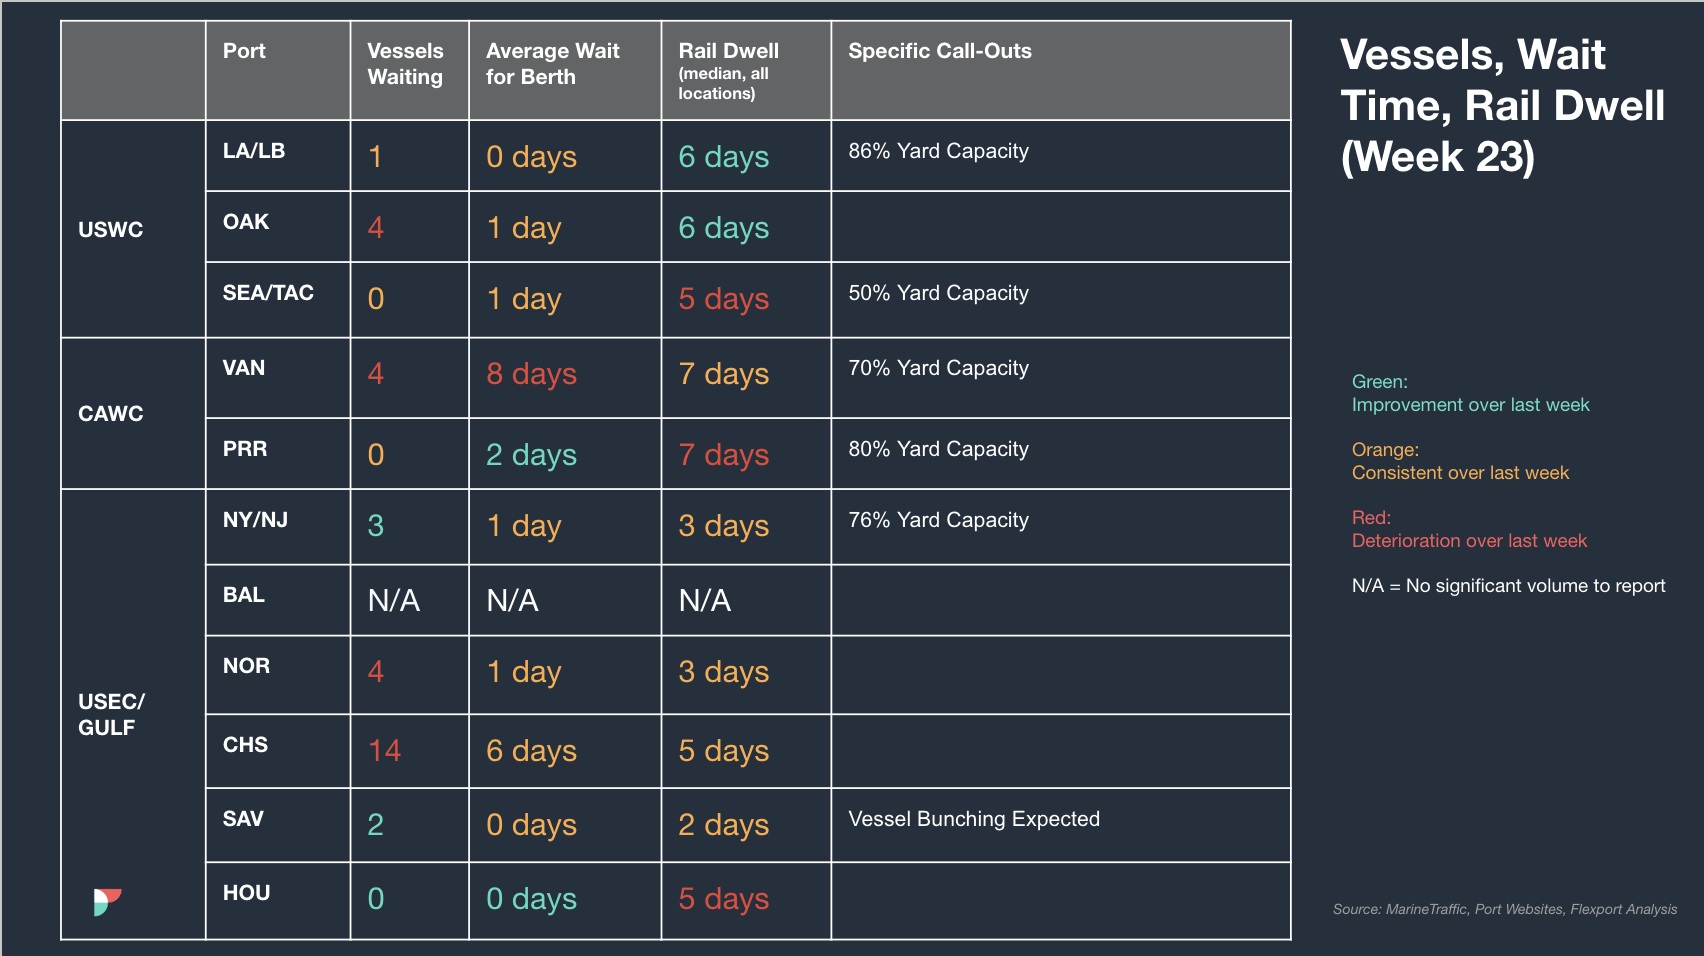
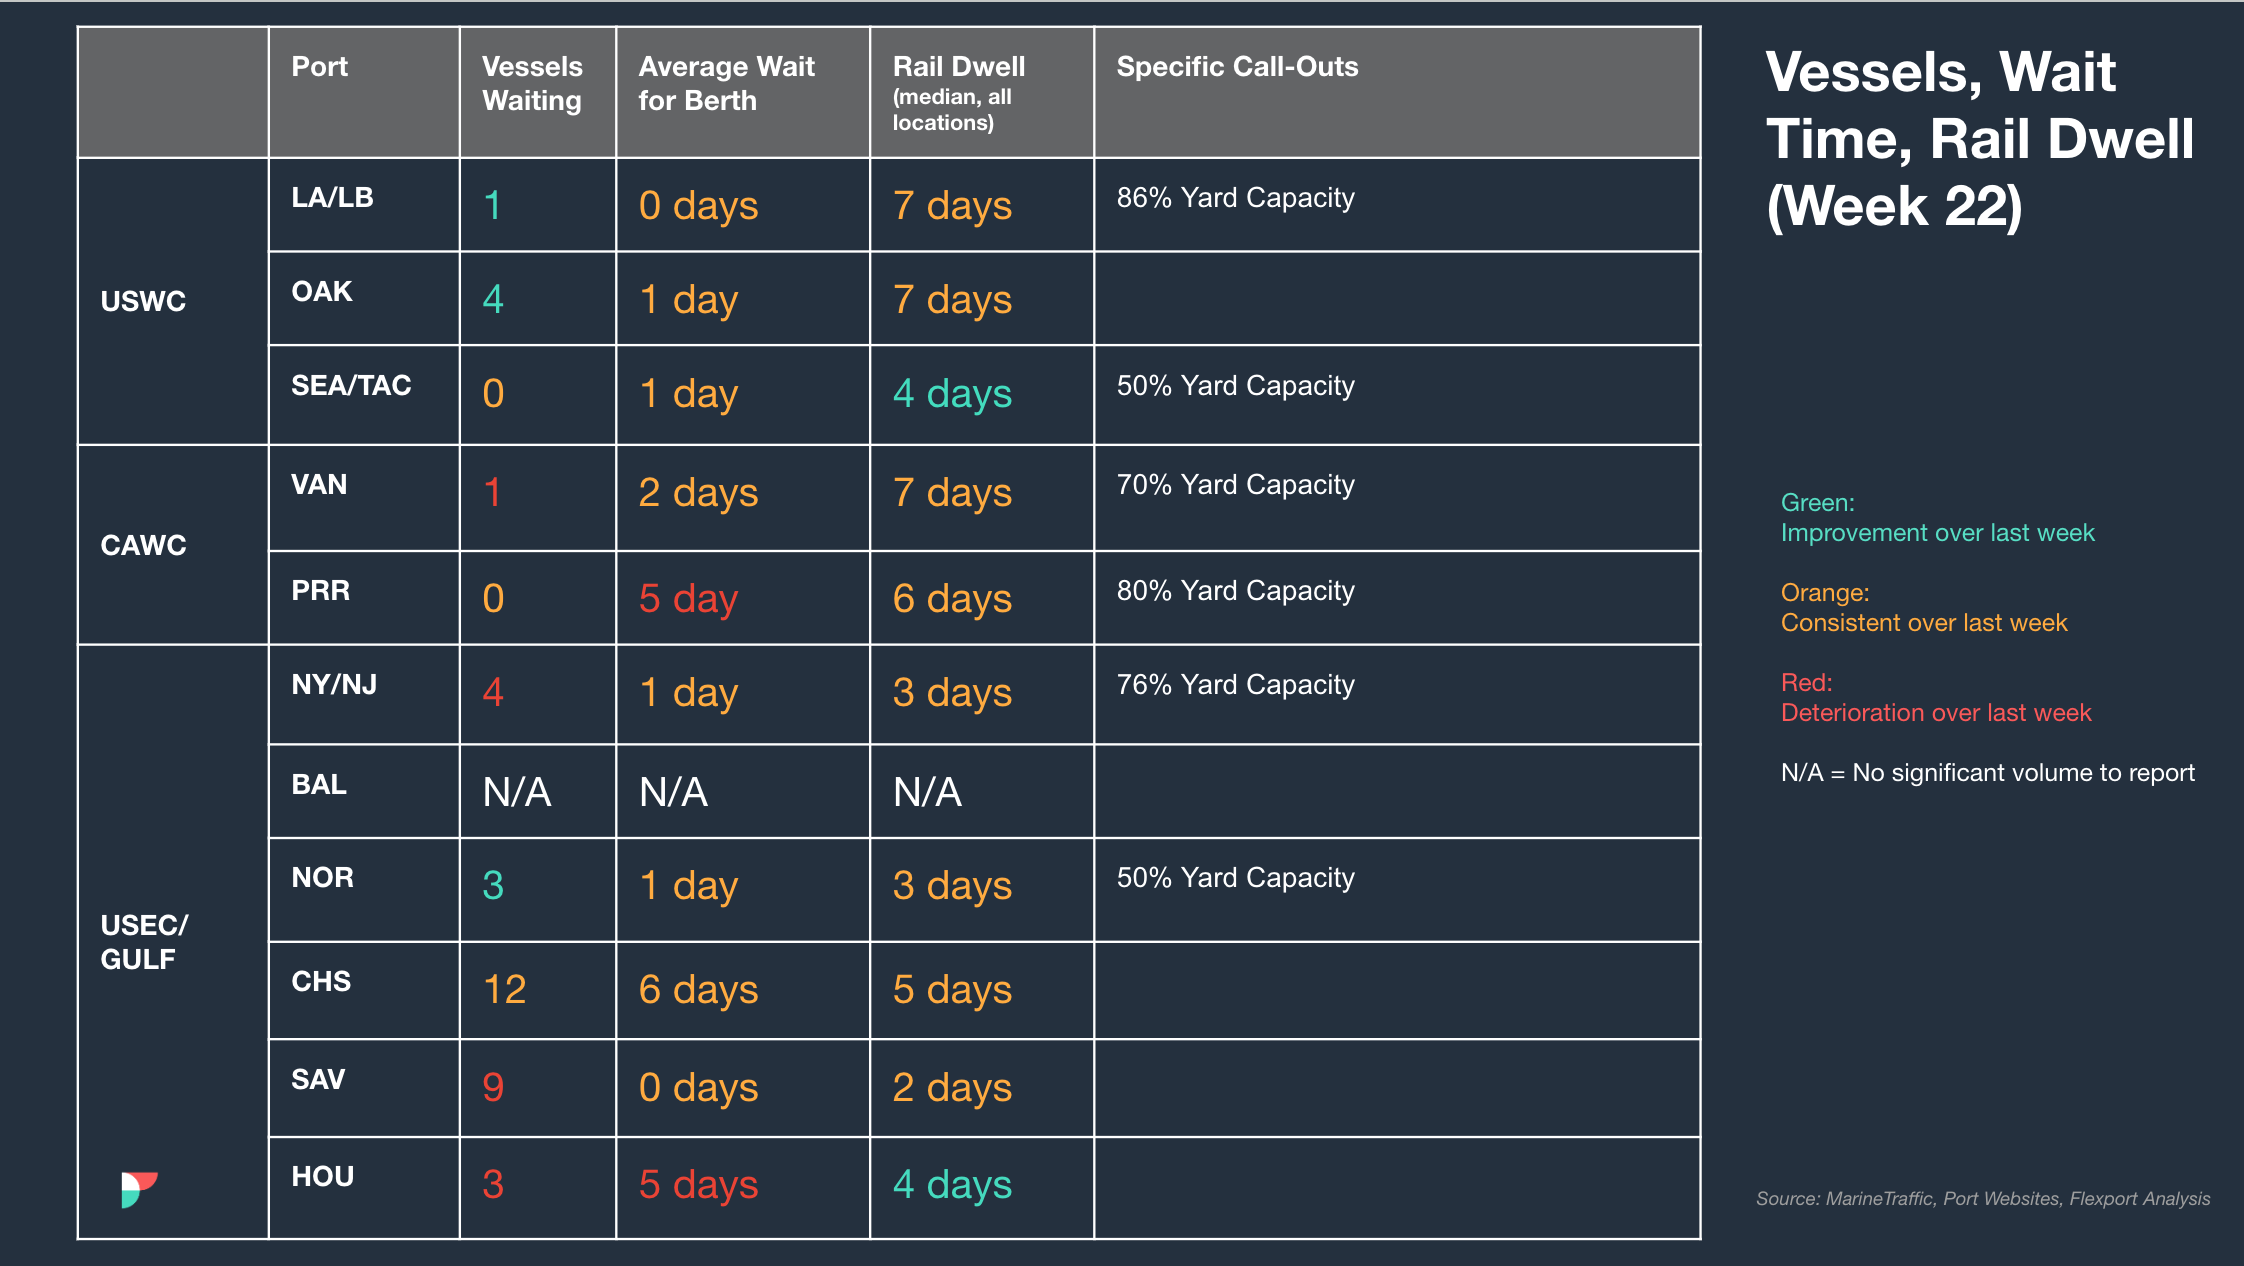
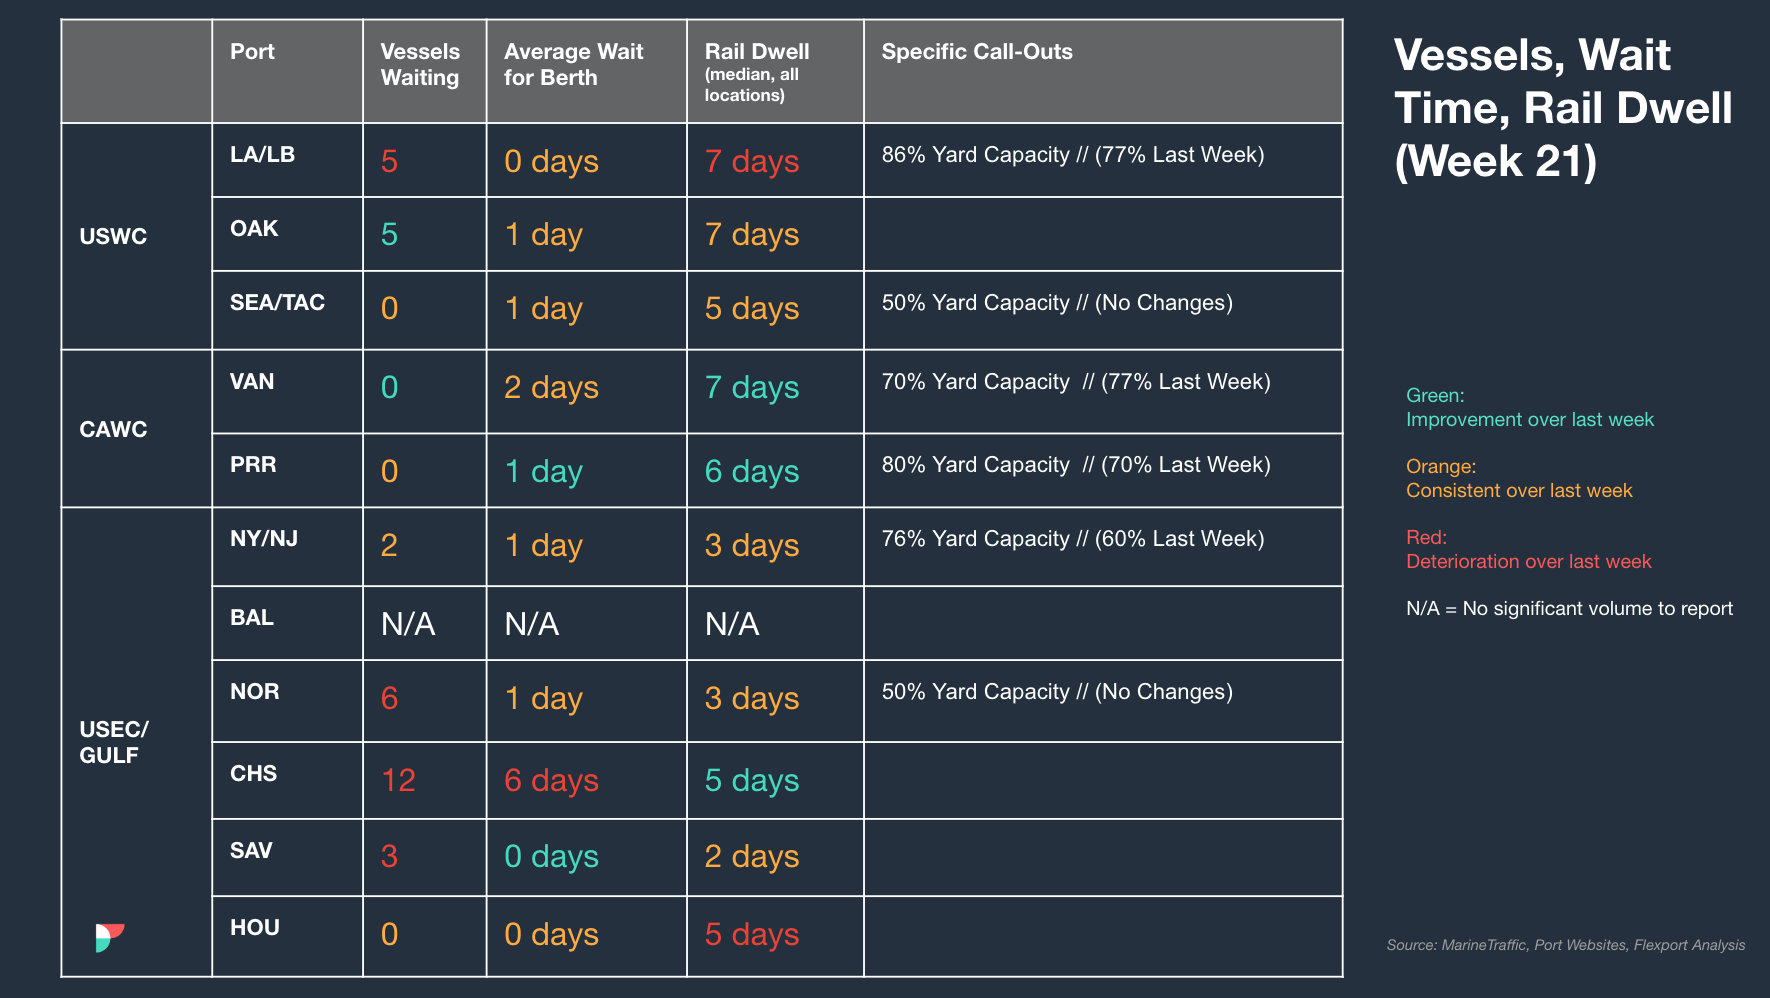
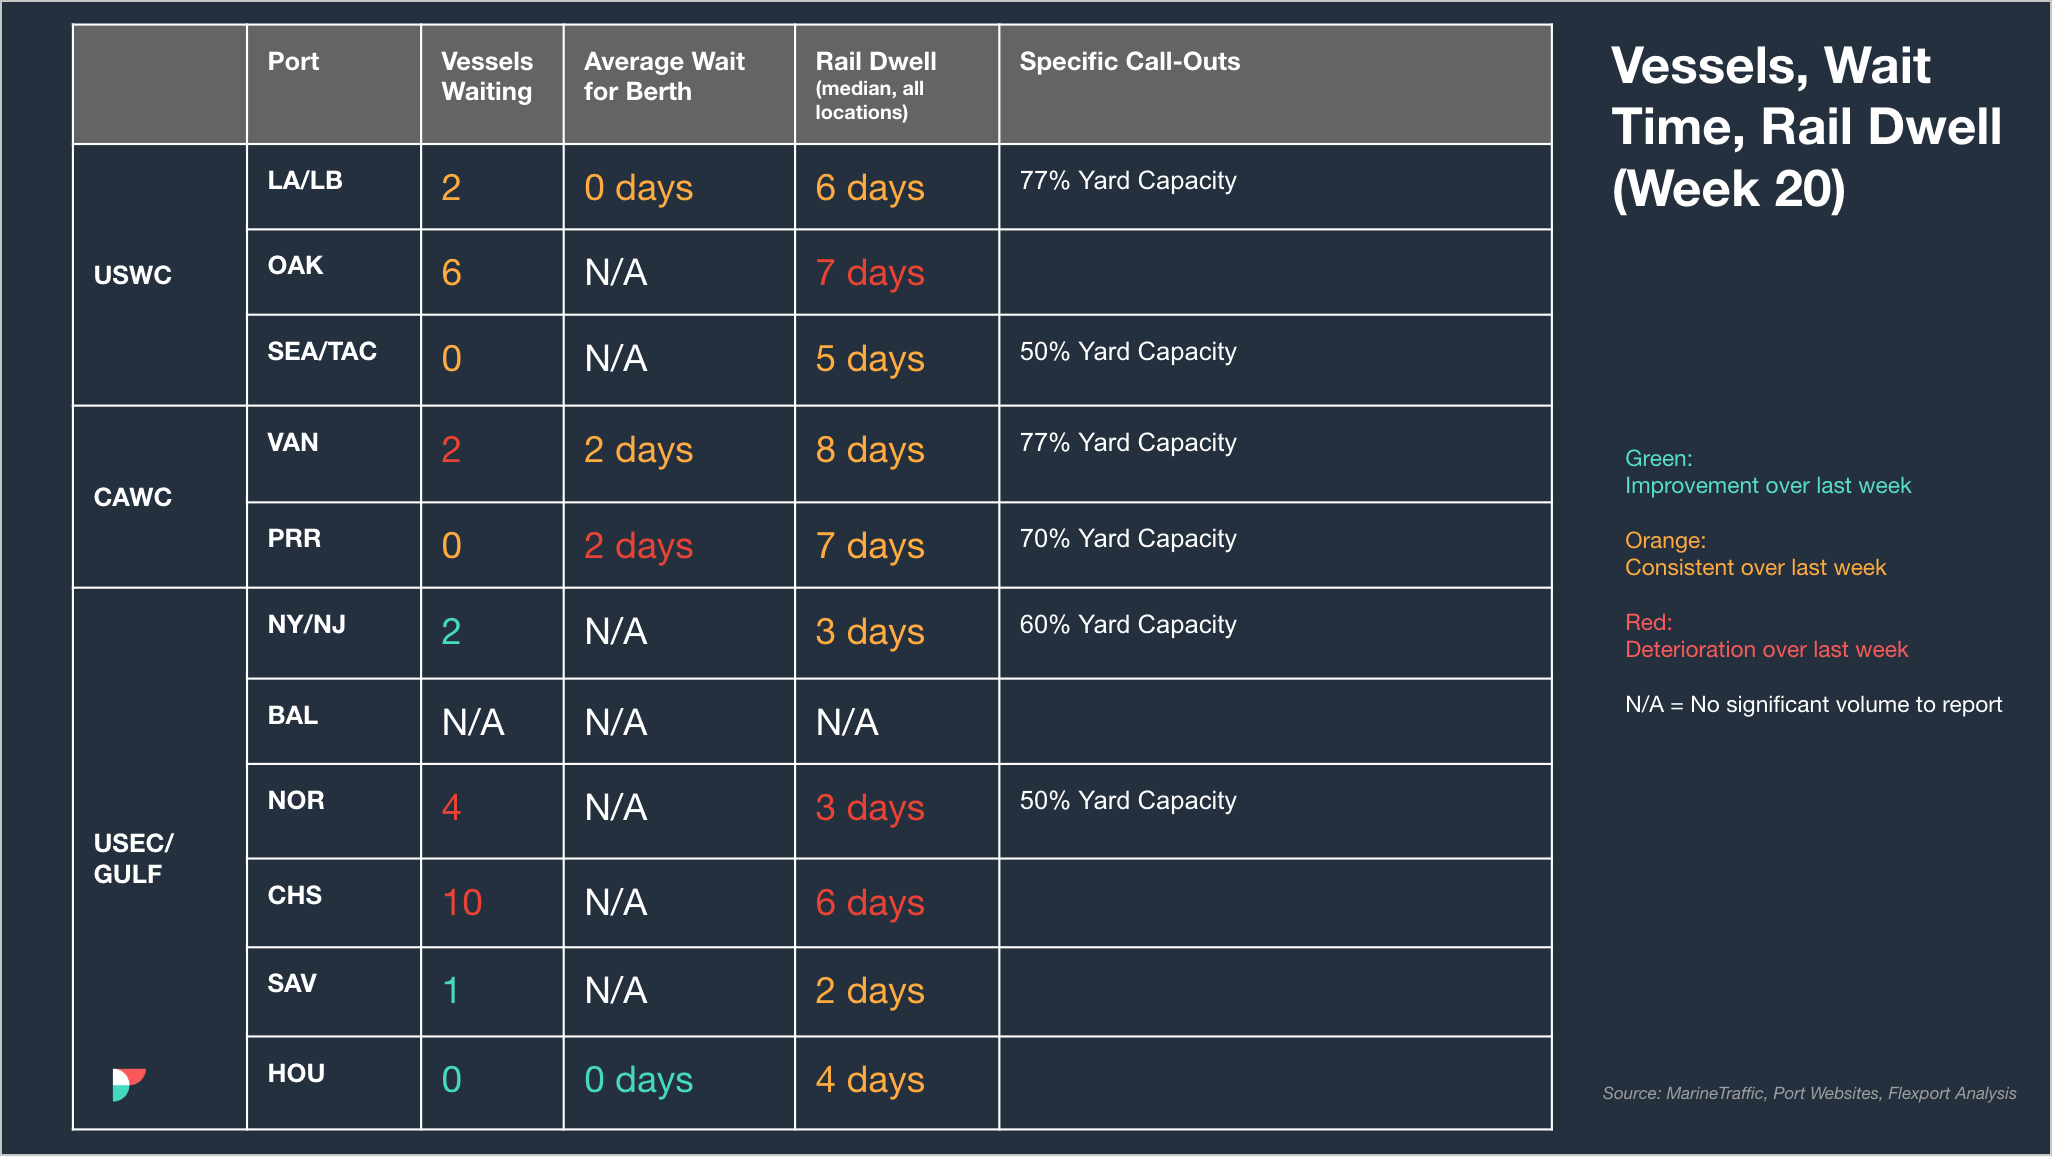
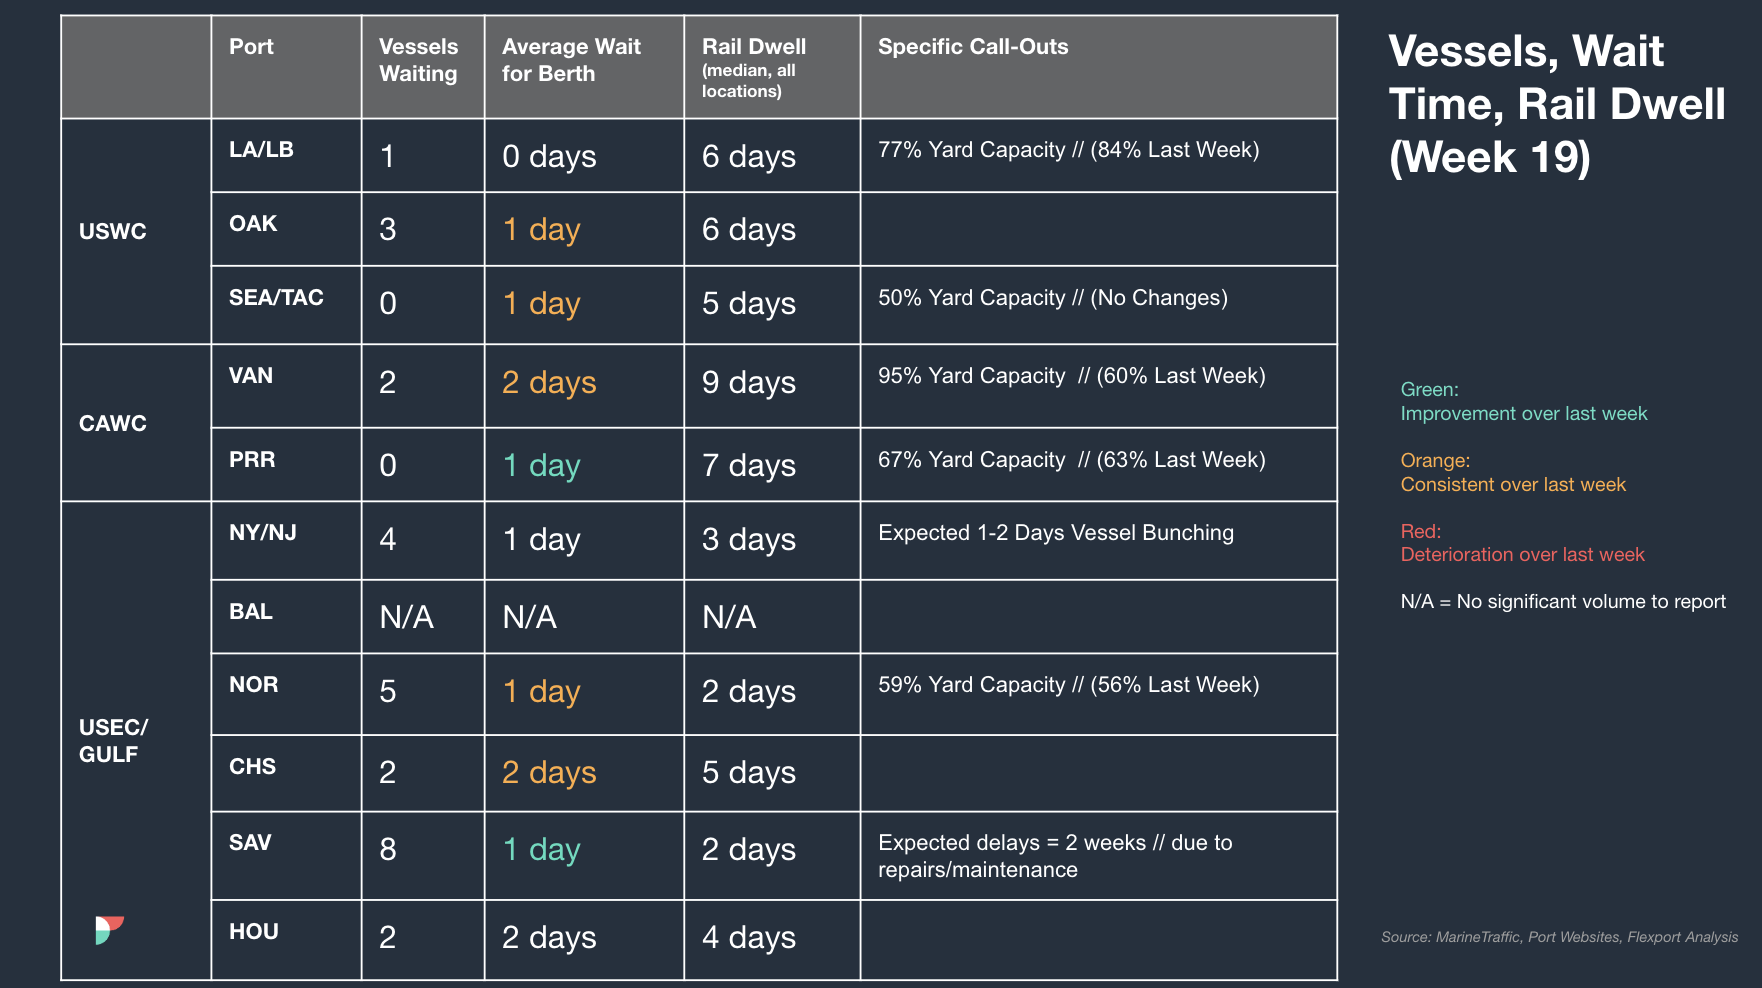
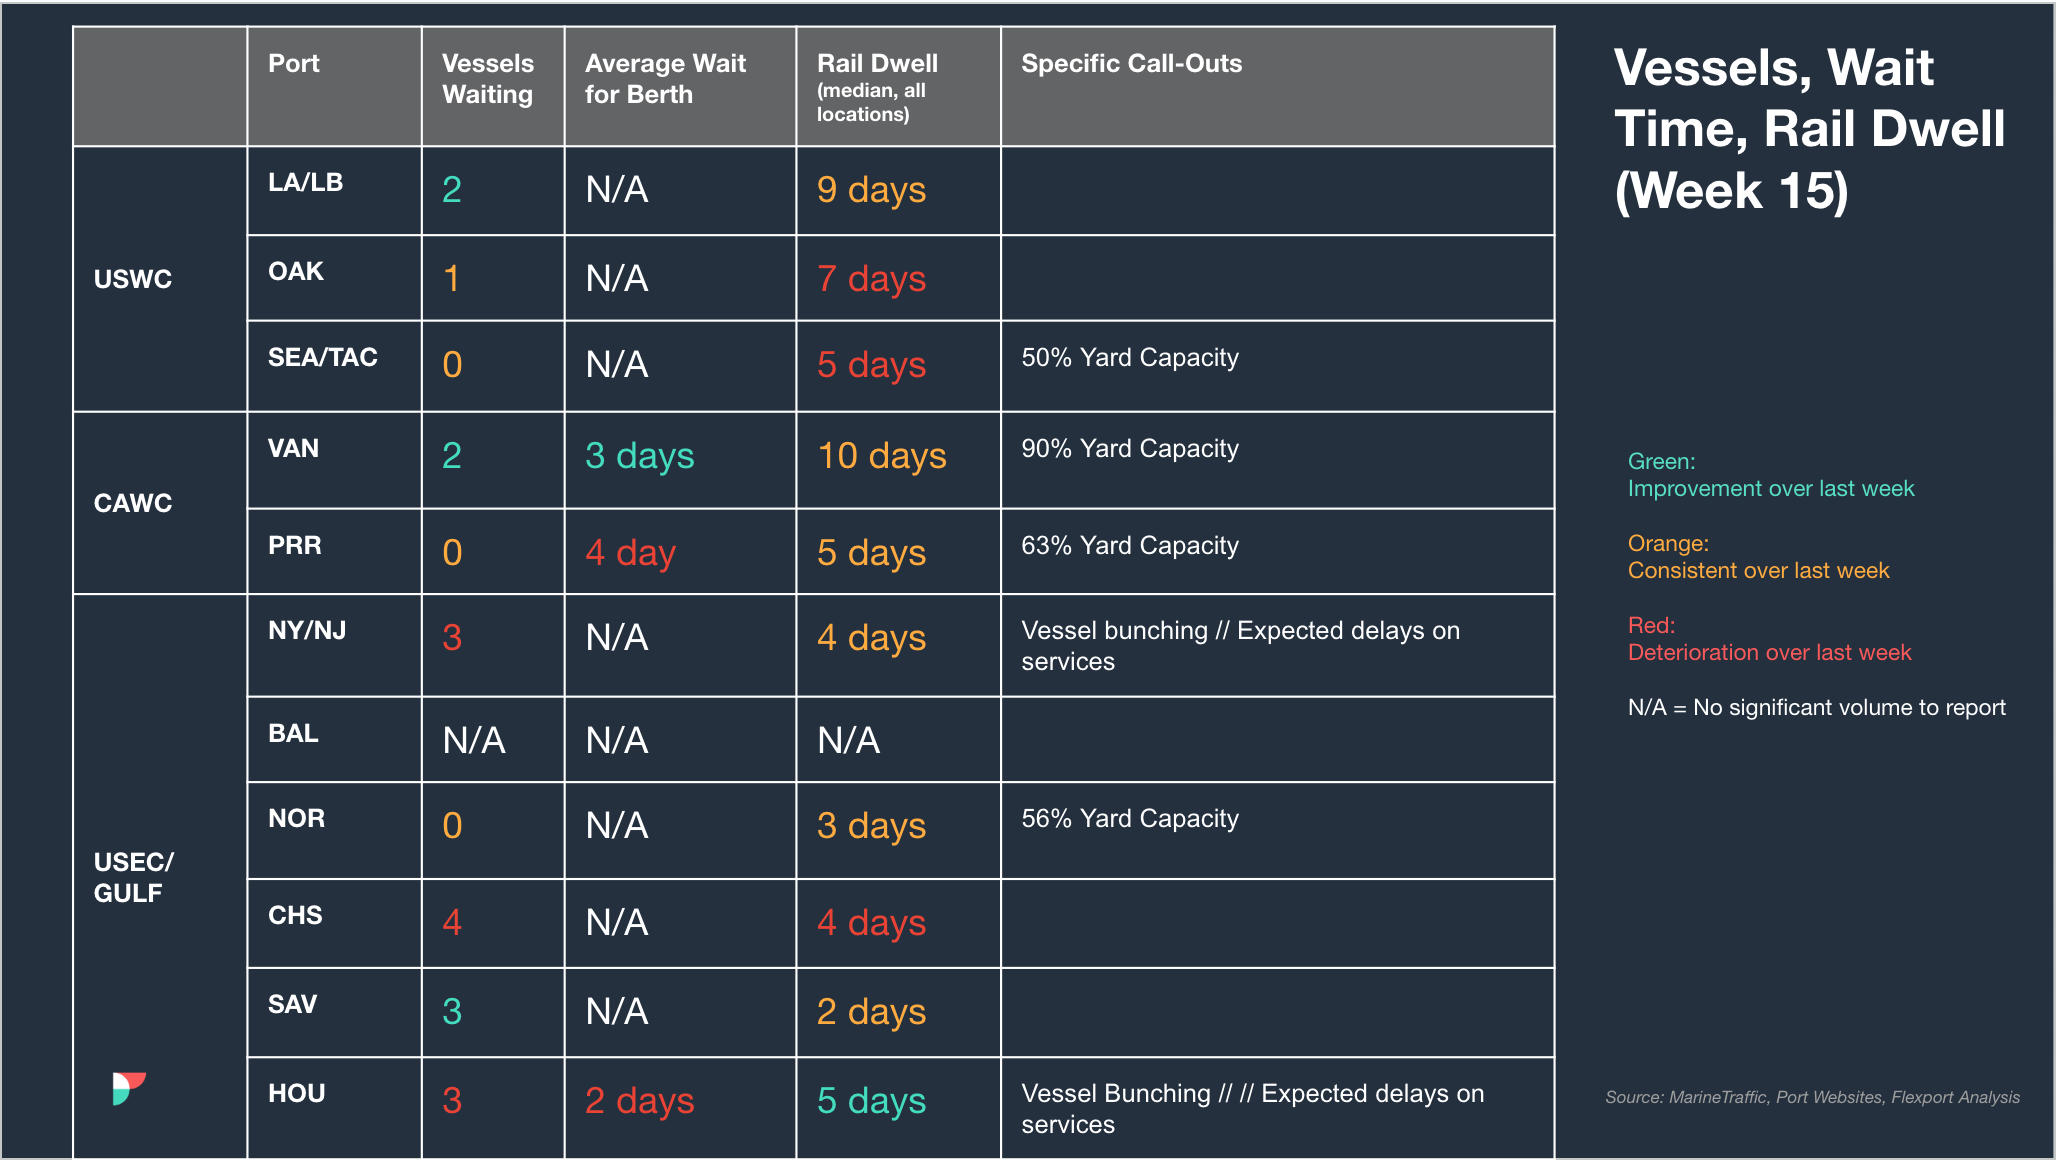
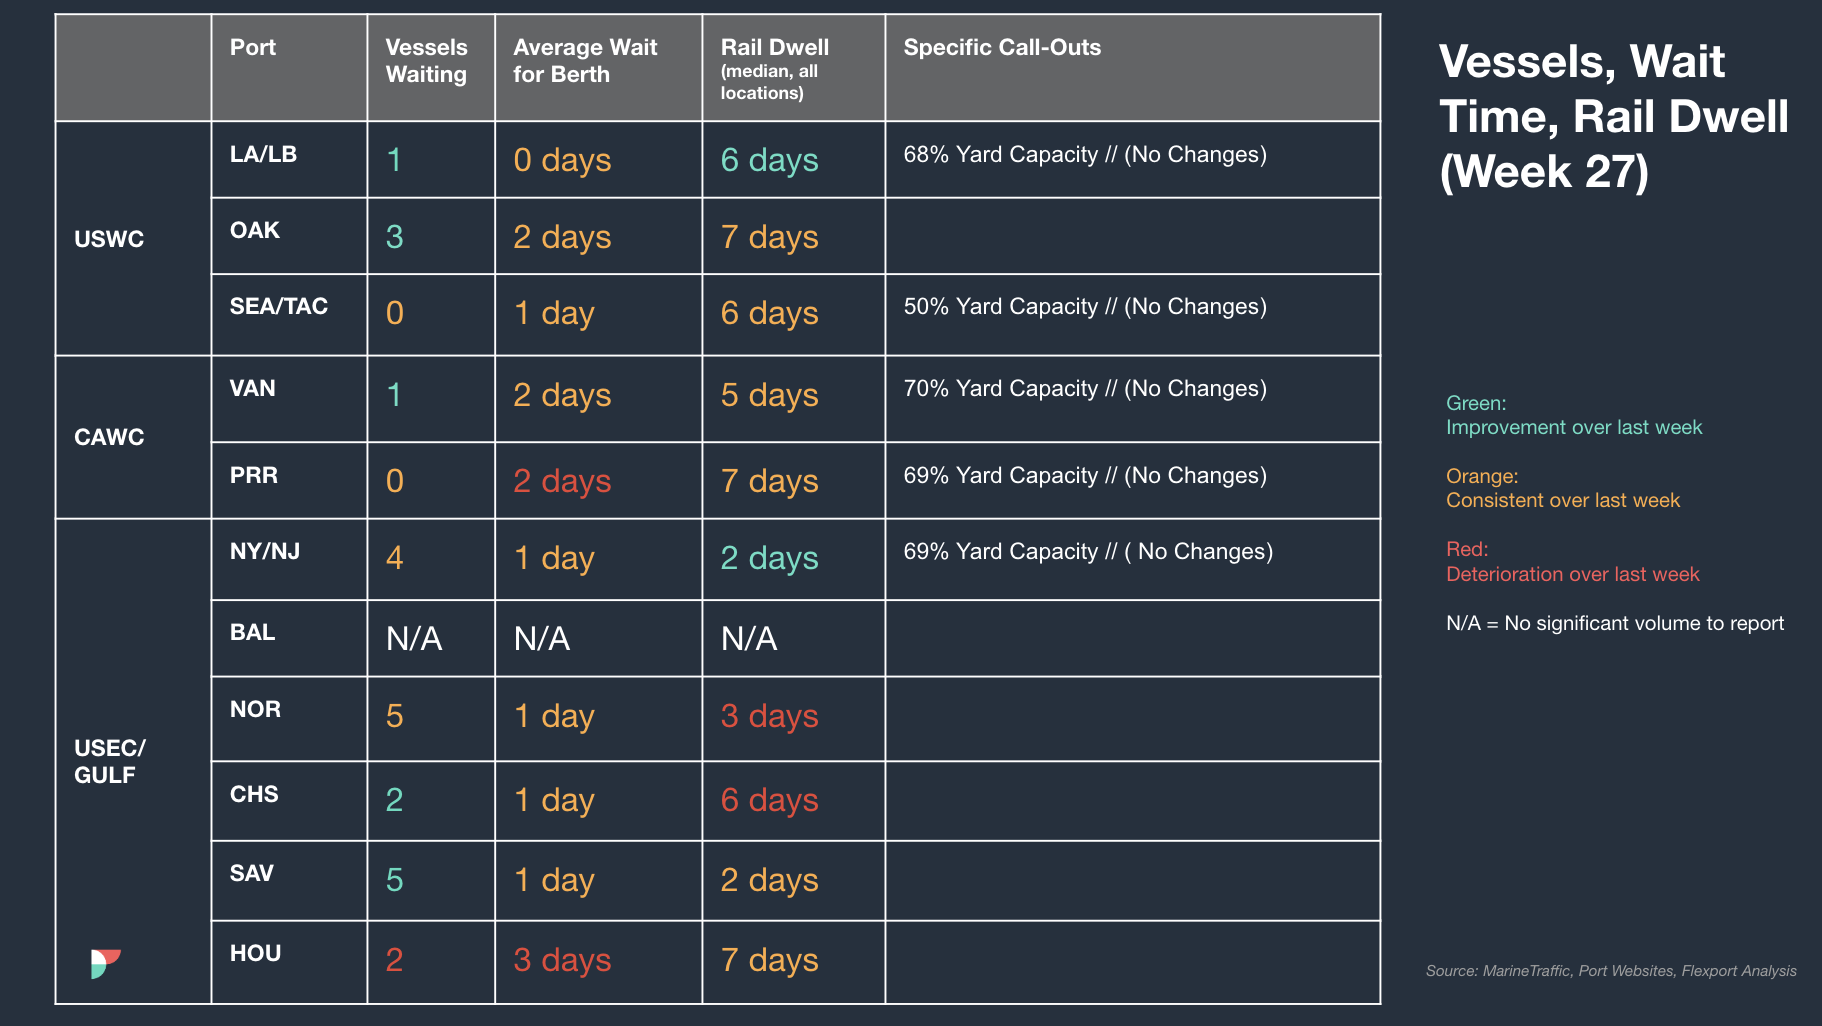
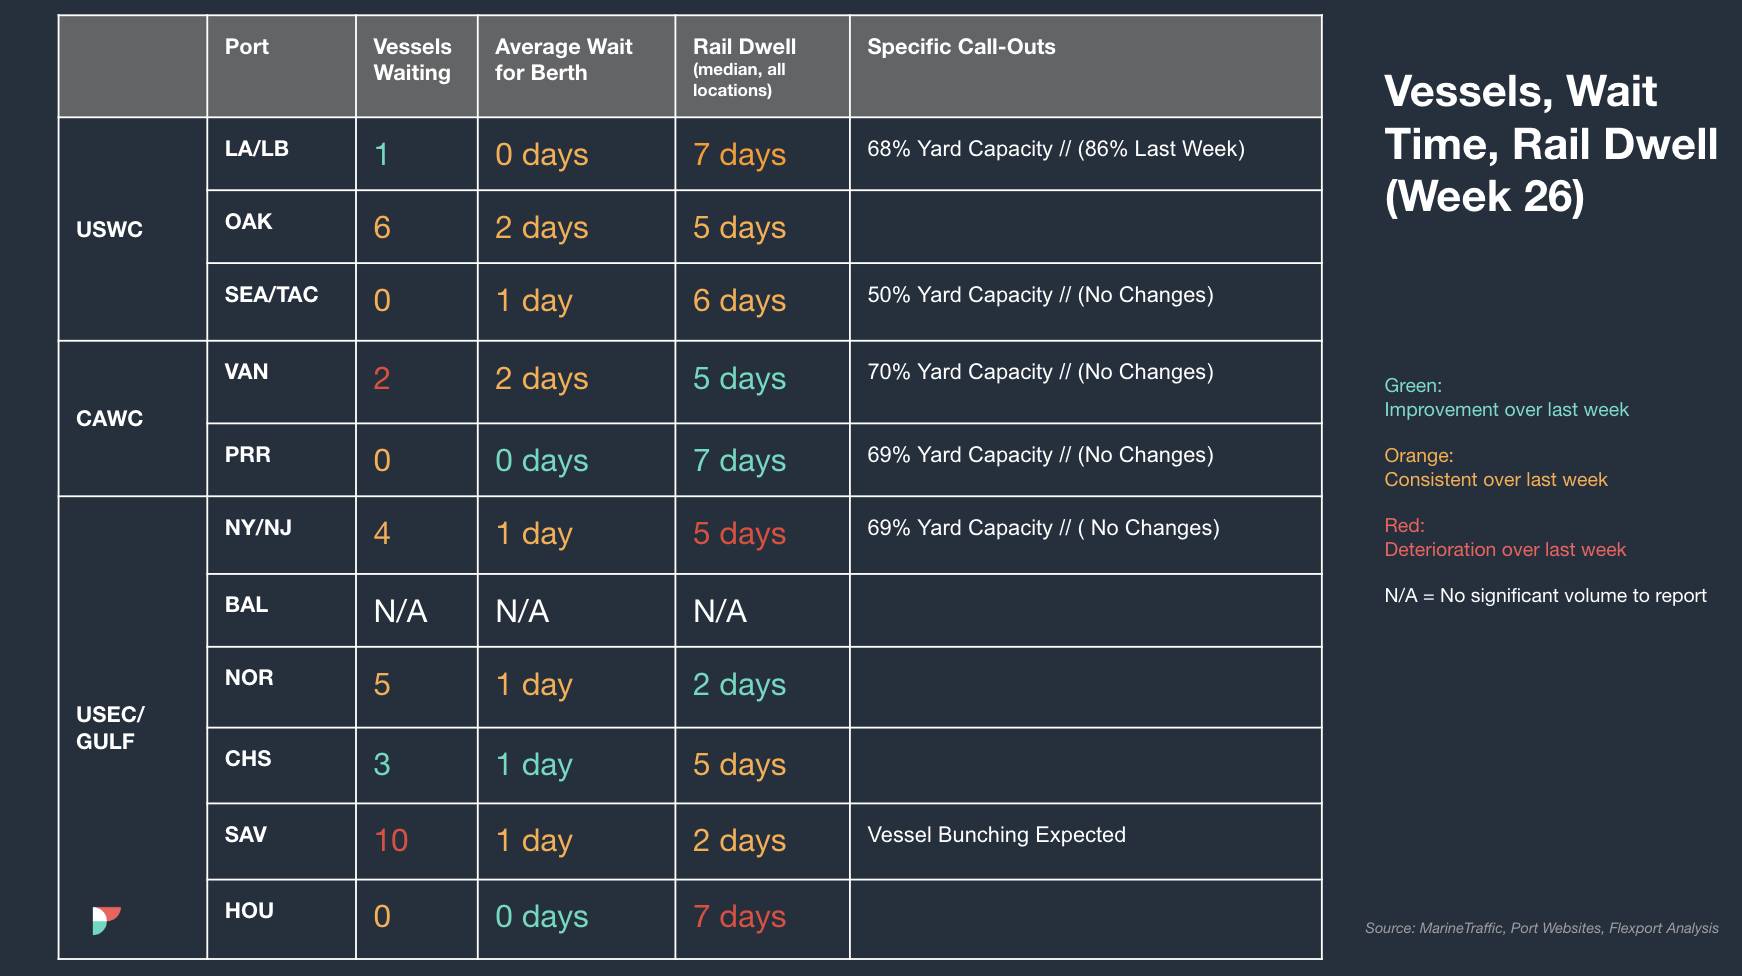
North America Vessel Dwell Times
 

markdown image


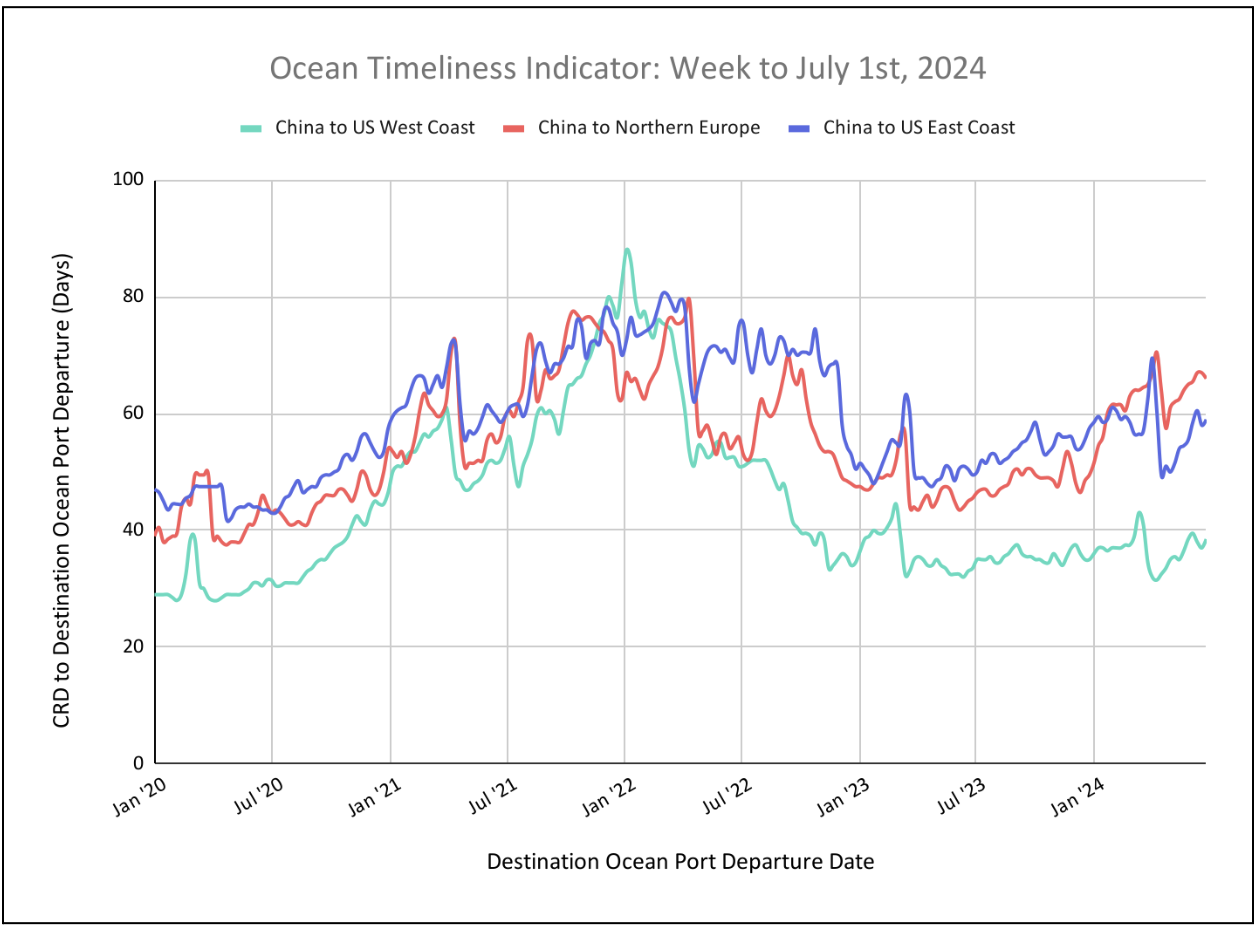
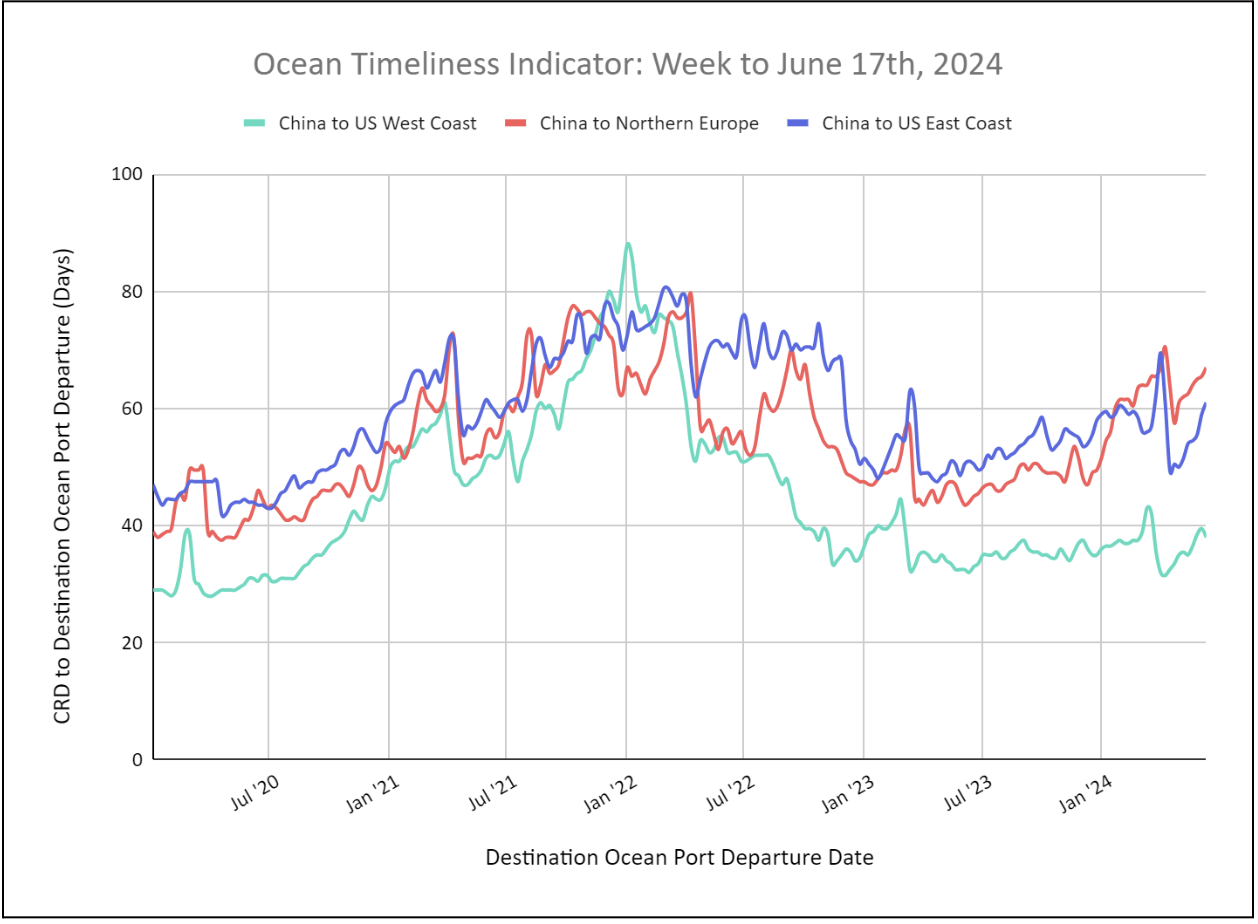
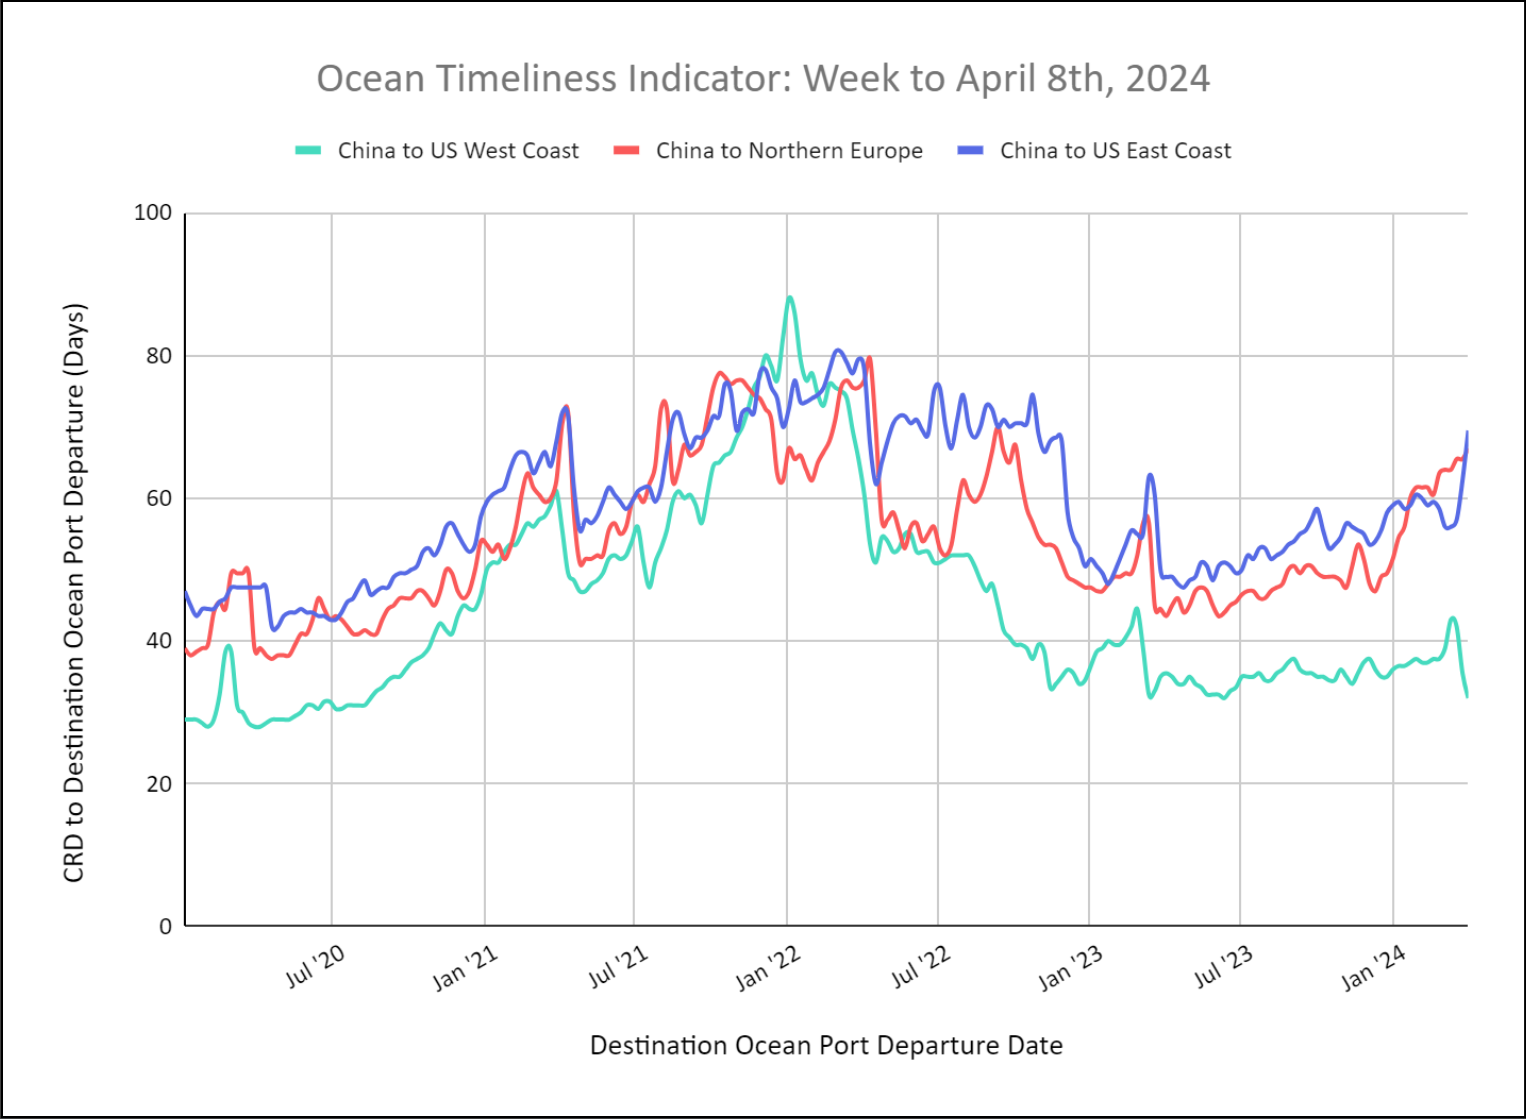
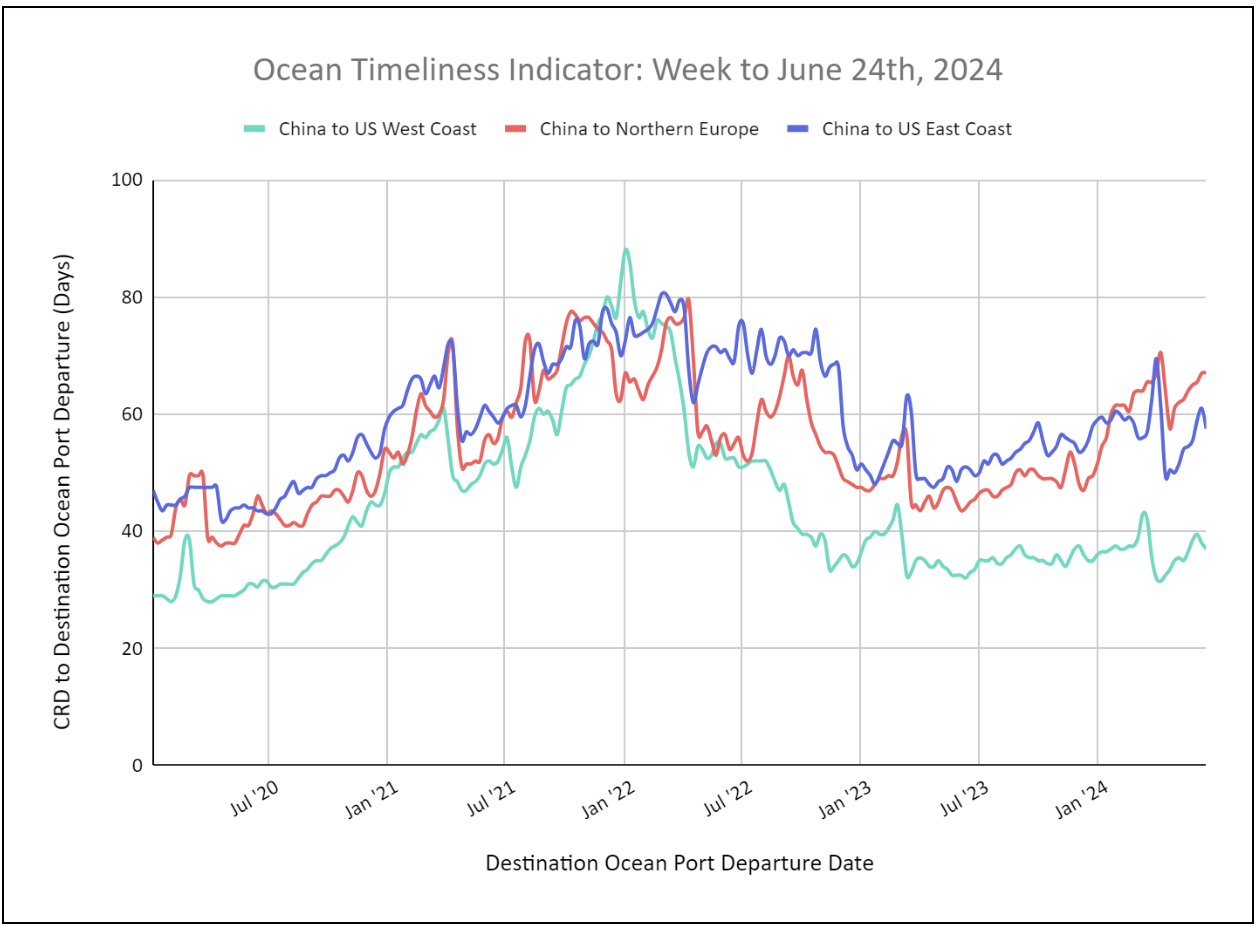
Flexport Ocean Timeliness Indicator

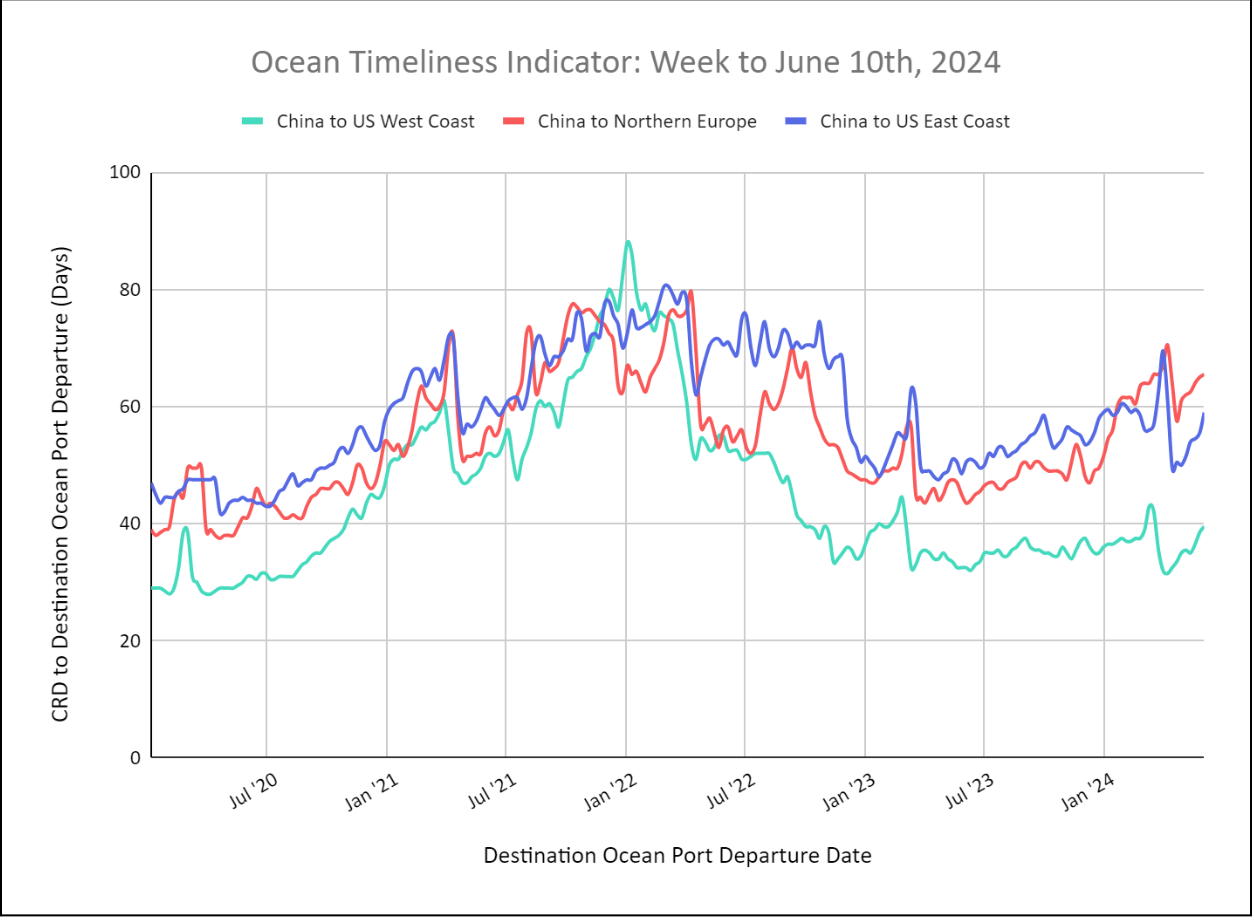
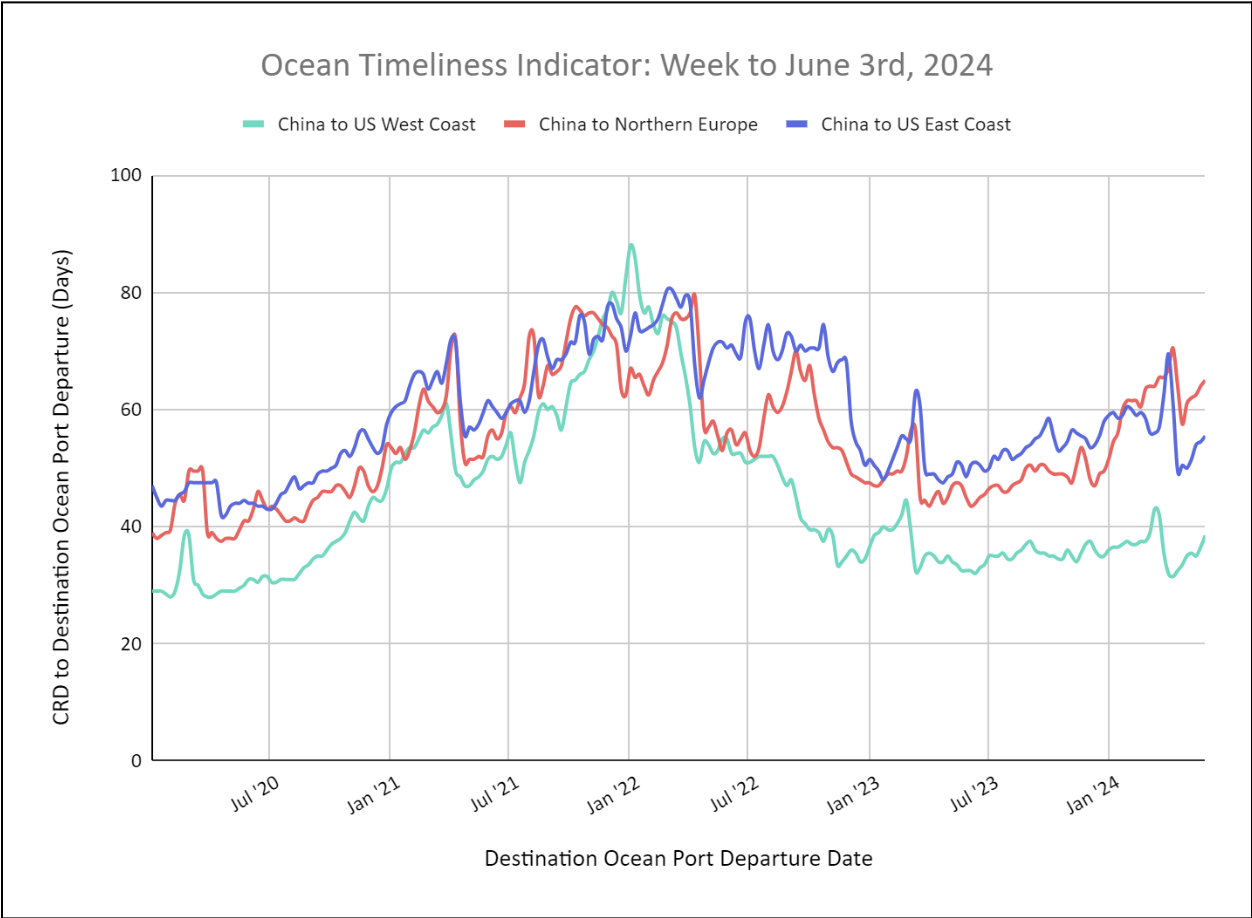
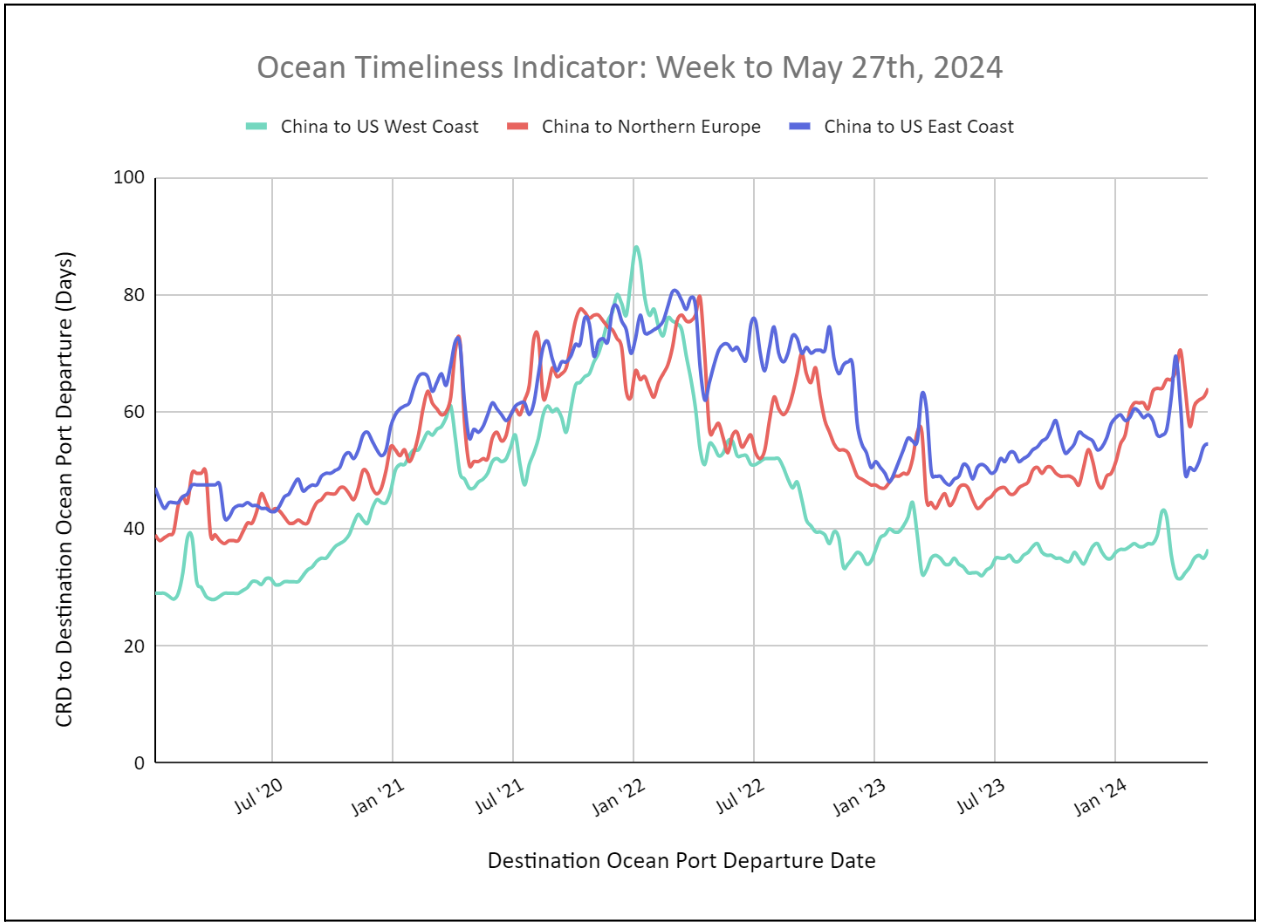
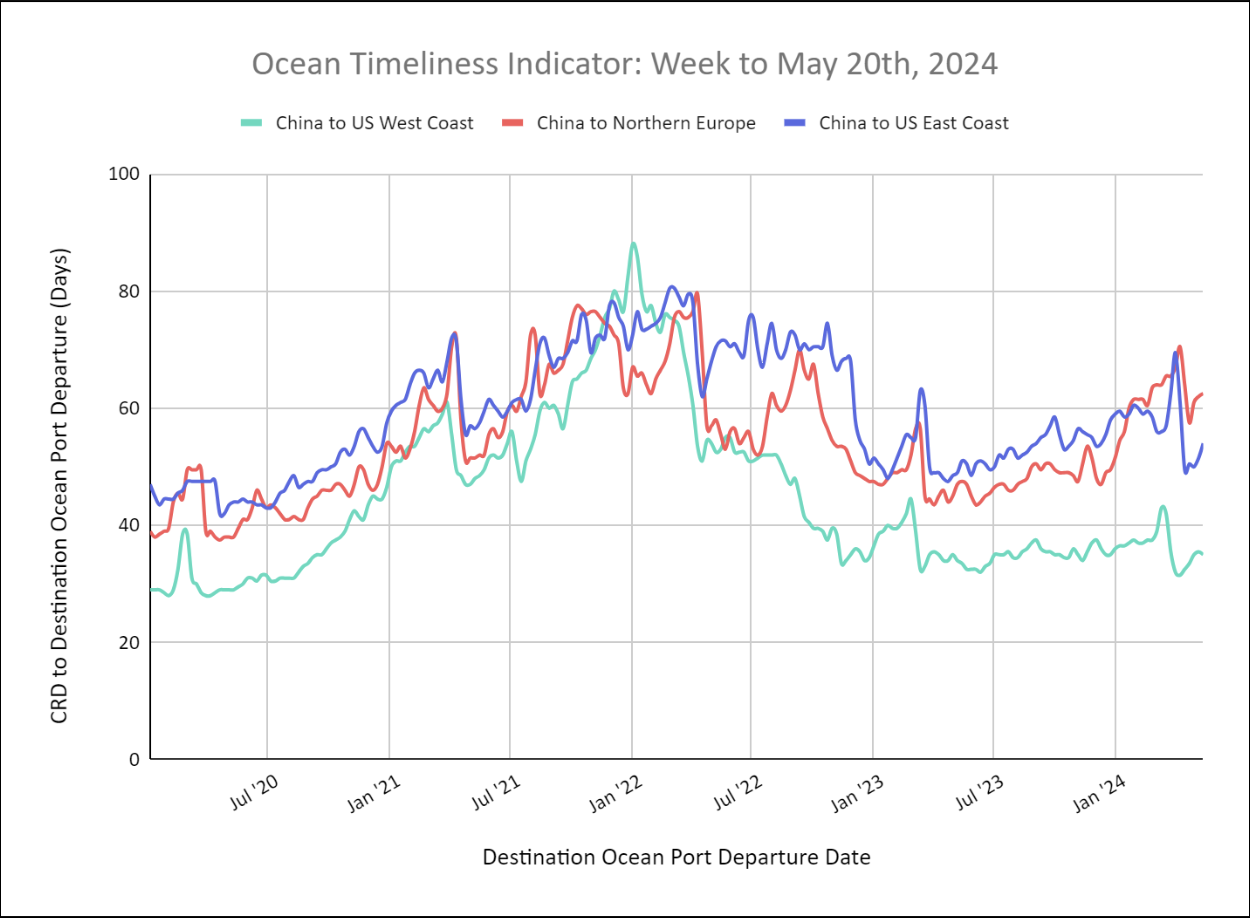
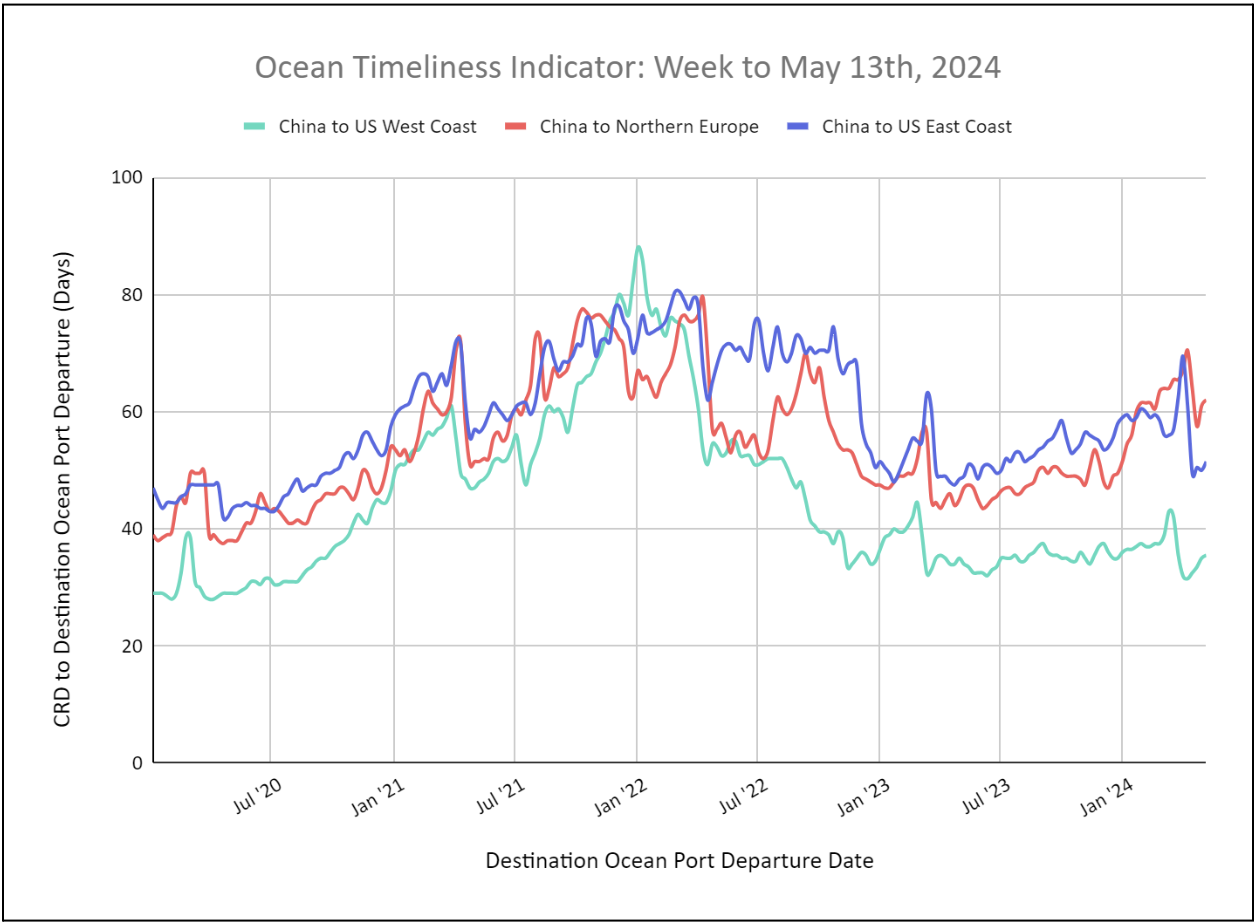
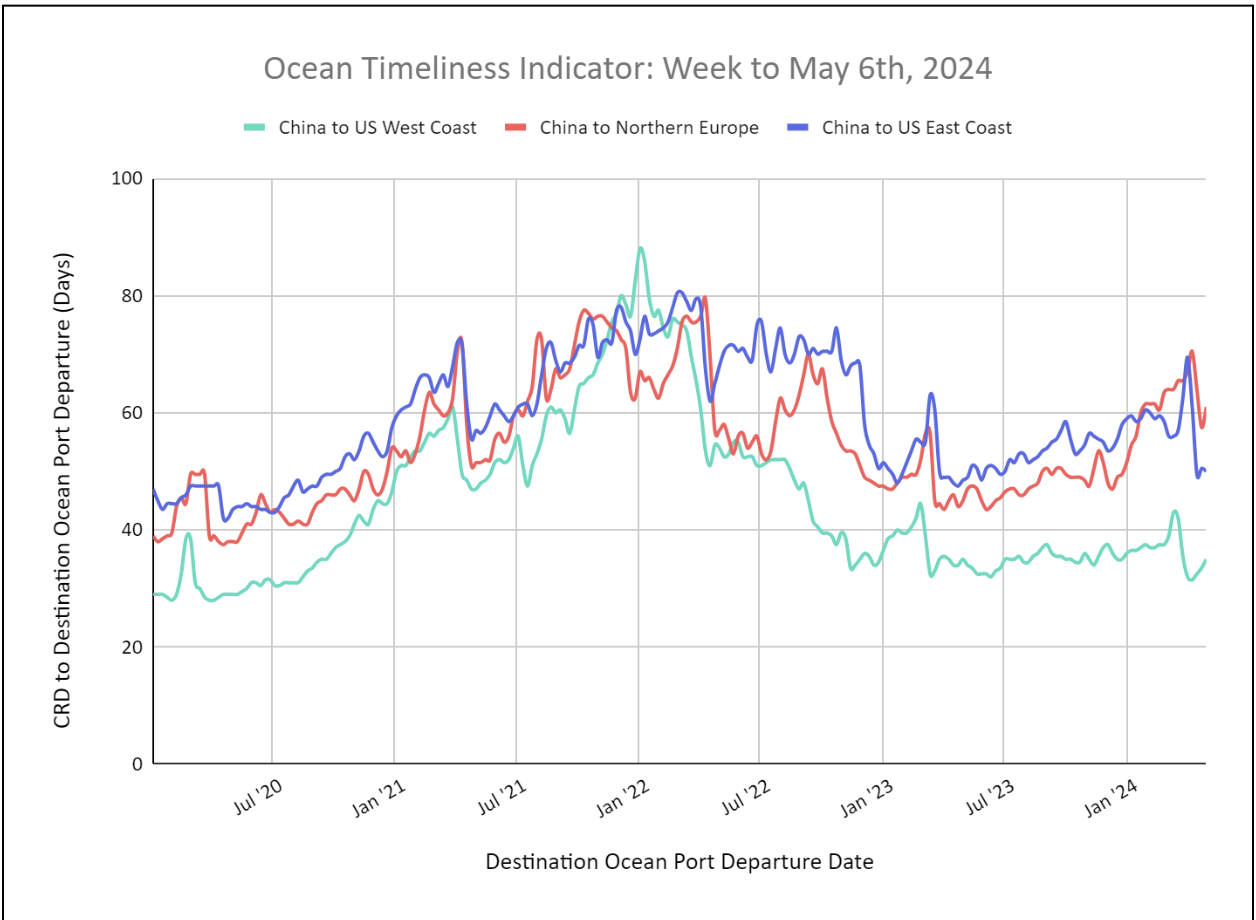
Ocean Timeliness Indicators for China to U.S. West Coast Decrease, While China to U.S. East Coast Increases.

Week to April 1, 2024

This week, the OTI for China to Northern Europe remained steady at 65 days due to carrier re-routings from the Suez Canal around the Cape of Good Hope. The OTI for China to the U.S. East Coast also remains elevated significantly to 62 days as some carriers route westward around Cape of Good Hope. Most have decided to use the Panama Canal despite continued slot restrictions. The OTI for China to the U.S. West Coast decreased to 36 days after a previous increase.


markdown image
Source from Flexport.com

Freight Market Update: March 28, 2024

Trends to Watch

[Ocean – FEWB]

  • For Asia-Europe trade, re-routing via Cape of Good Hope continues. Over the weekend, a Chinese-owned oil tanker called Huang Pu was attacked. Carriers are investigating the Indian Ocean status as well to determine if it’s safe for transport.
  • Ocean Alliance (CMA CGM Group, COSCO Shipping, Evergreen, and OOCL) Day 8 Product Update effective April 2024:
    • Restructure of all Asia to North Europe loops via Good Hope.
    • Offering 6 loops from Asia to North Europe with the widest coverage and largest capacity on the trade.
    • Suspension of FAL7 loop and Pusan call on FAL1. Pusan, Nansha, Hong Kong, and Ho Chi Minh will continue to be served with a dedicated mainliner/feeder to connect with our 6 loops sailing to North Europe with improved frequency and reliability.
    • The Tangier call will be switched from FAL3 to FAL1. Dunkirk will become the first call on FAL3, offering the French customers best-in-class service with two direct fast services: FAL1 into Le Havre and FAL3 into Dunkirk.
    • New FAL1 rotation: Ningbo, Shanghai, Yantian, Singapore, Tangier, Le Havre, Hamburg, Gdansk, Rotterdam, Port Kelang, Ningbo.
    • New FAL3 rotation: Qingdao, Shanghai, Ningbo, Yantian, Singapore, Dunkirk, Rotterdam, Southampton, Antwerp, Le Havre, Algeciras, Singapore, Qingdao.
  • Carriers are preparing to implement General Rate Increases (GRI) for April by $400-600 per FEU. While demand remains flat at the moment, more discussion is ongoing about current offerings and long-term deal finalizations, especially if the current Red Sea surcharges are upheld by carriers.
  • For historical updates on the Red Sea situation, read more in Global Ocean Carriers Halt Red Sea Transits – What to Expect.

[Ocean – FEWB]

  • Receiving for laden Exports at POL USBAL is closed until further notice.
  • Contingency options for U.S. Exporters who would traditionally use USBAL:
    • If moving cargo to North Europe, use POLs NYC, PHL, and Norfolk.
    • If moving to the MED, Middle East, ISC, or Africa, use POLs NYC and Norfolk.
    • If moving to Asia and you want to route all water service, use POLs NYC and Norfolk.
    • If moving to Asia and you want to avoid USEC altogether, FTL and transload to a USWC port or CHI.

Please reach out to your account representative for details on any impacts to your shipments.

Francis Scott Key Bridge Collision and Collapse – What to Expect

At about 1:30 am ET on Tuesday, March 26, the Francis Scott Key Bridge in Baltimore, MD collapsed after being struck by a container ship. The ship, named DALI, is about 300-meters long and 94,000 tonnes. The vessel is operated on charter by Maersk on the 2M Alliance service between Asia and the US East Coast.

The DALI was traveling from Baltimore to Colombo, Sri Lanka when, according to local reports and videos, the ship lost power prior to hitting a structural pillar of the bridge. The bridge collapsed instantaneously. Local authorities are treating the situation as a mass casualty incident; our thoughts are with those impacted.

While it’s still early, we anticipate considerable downstream impacts to the Port of Baltimore, US East Coast ports, and regional rail and trucking networks.

Immediate Impact of Bridge Collision and Collapse
As of March 26, there were more than 40 ships, including cargo ships, currently inside the Port of Baltimore or on the Patapsco River west of the Francis Scott Key Bridge that were unable to leave the area. The impact to cargo depends on exactly where it is and the approach the Port of Baltimore takes in the evolving situation. Cargo already discharged from vessels should be able to be picked up from port. Cargo not yet discharged from vessels will likely experience discharge delays based on port operations. And cargo on trapped vessels that are planned to be unloaded at other East Coast ports will be subject to the direction taken by the vessel operator. There’s potential to redistribute the cargo to other ports via truck or rail, but this would require a coordinated effort from the vessel operators and the Port of Baltimore.

Container vessels with Baltimore in their rotation – 107, as of the incident – will likely head to surrounding ports like Norfolk or New York/New Jersey and discharge cargo there. Norfolk and New York/New Jersey are typical port calls for vessels that head to Baltimore, so while the direct vessel schedules should be able to adapt to the situation, the positioning of cargo on the vessels will likely cause discharge delays and importers will have to navigate different options such as long distance drayage or transloading to deliver the cargo to the final destination.

The collapse of the bridge implies that water access to the container terminals, along with various other terminals at the port in Baltimore, will be temporarily blocked.

Downstream Effects to Neighboring Ports
While the Port of Baltimore is one of the smaller ports by containerized freight volume on the US East Coast, handling roughly 800k TEUs in 2023, compared to neighboring ports like the Port of New York and New Jersey at 5.1 million TEUs in 2023 and the Port of Norfolk at 2.4 million TEUs in 2023, it’s an essential port with specialized infrastructure to handle bulk commodities in a major manufacturing corridor.

To put it into context, if the cargo originally destined for the Port of Baltimore is redistributed exclusively among the Ports of NY/NJ and Norfolk, throughput at these ports would increase by just under 10%. The moderate volume increase is less of a concern, as the bigger question is whether the truck and rail systems can quickly adapt to handle this sudden 10% surge in cargo volume.

A major unknown as of now is how long it will take for the waterway to be cleared and Port of Baltimore operations to return to normal. The resolution timeline will determine the magnitude of downstream impacts to port and inland operations on the East Coast.

The Takeaway
This is an evolving situation. It’s too early to tell how rates to the US East Coast could be impacted, if ocean carriers will establish temporary booking stops to Baltimore, or if shippers will elect to re-route to alternate US East Coast ports or even the US West Coast as point of entry. Flexport is in contact with all ocean carriers that call Baltimore and will continue to provide updates.

Before making changes to your shipments, such as electing to re-route cargo, reach out to your dedicated Flexport account manager to discuss all your options. Flexport can help you design a routing to balance cost and speed, based on the current advice for your trade lane.

North America Vessel Dwell Times


markdown image

Flexport Ocean Timeliness Indicator

Ocean Timeliness Indicators for China to Northern Europe and China to the U.S. East Coast Increase. Indicators for China to the U.S. West Coast Decrease.

Week to March 25, 2024

This week, the OTI for China to Northern Europe increased to 65 days due to carrier re-routings from the Suez Canal around the Cape of Good Hope. The OTI for China to the US East Coast also remains increased to 57 days as some carriers route westward around Cape of Good Hope while most have decided to use the Panama Canal despite continued slot restrictions. The OTI for China to the US West Coast decreased slightly to 42 days.


markdown image

Source from Flexport.com

Freight Market Update: March 21, 2024

Trends to Watch

[Air – Global] (Data Source: WorldACD/Accenture)

  • Dubai to Europe air cargo tonnages have seen a substantial increase, with a +205% rise compared to last year and a +7% increase from the previous week, driven by disruptions in Asia-Europe container shipping while overall global demand stabilized.
  • Key Asia-Europe sea-air hubs, including Dubai, Colombo, and Bangkok, have experienced significant air cargo demand to Europe since early 2023, with Dubai-Europe tonnages more than doubling year-on-year due to the Red Sea situation.
  • While Bangkok to Europe demand continues to rise, with a +33% year-on-year increase in week 10, Colombo to Europe demand shows signs of softening, with a growth of +20% compared to +35% the previous week.
  • Globally, air cargo tonnages stabilized with a slight increase in average rates to $2.32 per kilo in week 10, following a post-Lunar New Year recovery in demand, particularly from the Asia Pacific region.
  • Worldwide air cargo capacity is up by +9% year-on-year, with significant increases from Asia Pacific and Central & South America, while average rates remain above pre-COVID levels, indicating a robust recovery in the sector.

[Ocean – FEWB]

  • Asia-North Europe: For Asia-Europe trade, most vessels continue to reroute via the Cape of Good Hope. Some carriers are investigating the possibility of routing back to the Suez Canal, but so far no further announcements. The news indicates that vessels in the Indian Ocean and the Cape of Good Hope may also be impacted by the situation. We’re closely monitoring and following up with carriers.
  • After Maersk & Hapag Lloyd announced the Gemini Cooperation commencing in 2025, Ocean Alliance (CMA CGM Group, COSCO Shipping, Evergreen, and OOCL) confirmed the renewal of The Ocean Alliance partnership for another 5 years. Following the renewal, effective April 2024, there will be some service adjustments. Details to follow once we learn more. So far, the new deployment plan shared by Ocean Alliance for Asia to Europe would be:
    • 6 services between Asia and Northern Europe.
    • 4 services between Asia and the Mediterranean.
  • The floating market rate keeps dropping. Some carriers are preparing to implement GRI for April by $600-800 per FEU. While demand remains flat at the moment, more discussion is ongoing about current offerings and long-term finalizations, especially if the current Red Sea Surcharges will be upheld by carriers.

North America Vessel Dwell Times


markdown image

Flexport Ocean Timeliness Indicator

Ocean Timeliness Indicators for China to Northern Europe and China to the U.S. East Coast Remain Steady. Indicators for China to the U.S. West Coast Increase.

Week to March 18, 2024

This week, the OTI for China to Northern Europe remains steady at 64 days due to carrier re-routings from the Suez Canal around the Cape of Good Hope. The OTI for China to the U.S. East Coast also remains elevated, yet steady, at 56 days as some carriers route westward around Cape of Good Hope while most have decided to use the Panama Canal despite continued slot restrictions. The OTI for China to the U.S. West Coast increased to 43 days.


markdown image
Source from Flexport.com

Freight Market Update: March 14, 2024

TPM24 Takeaways

There is no better chance to learn about the state of the industry than the annual Transpacific Maritime (TPM) Conference. TPM ‘24 took place between March 3-6 at the Long Beach Convention Center. Flexport’s team was on site to chat with, and learn from, our customers and carrier partners—both current and potential. Here are our top insights for the coming year.

  • Uncertainties Persist. The supply chain is getting more complex every day. The situation in the Red Sea was top of mind at TPM, as well as Panama Canal restrictions, and ILA contract negotiations. Uncertainty drives anxiety. As a global logistics platform, we can help de-risk the supply chain for our customers and give actionable, data-driven advice on how to manage your procurement decisions in 2024 and beyond.
  • Diversifying means protection. In previous years, shippers and service providers would get into a meeting room and already know exactly what the rates would be. Everyone would sign the contract, and the following year, sign the same contract again. That’s no longer the case. With this market’s persistent uncertainty over the past few years, customers are starting to embrace how diversifying their carrier and forwarder portfolio can foster more agility. For example, larger customers are willing to embrace different routings to ensure disruptions don’t impact their business too strongly. Shippers are also looking for unique ways to keep their business moving, and really understanding how forwarders and brokers can create opportunities and solutions for better protection when moving supplies globally.
  • Technology and visibility are the future. Customers are excited about technology and modernization. Current and potential customers had a lot of questions about integrations, and almost every shipper we spoke with is looking for real-time, accurate shipment and SKU-level visibility. Everyone is data-hungry and looking for solid solutions. Having visibility into your goods is not just critical for managing an efficient, modern supply chain; visibility helps shippers — Flexport’s customers — improve the customer experience for their own customers, too. Visibility is foundational to managing customer expectations as consumers want to know when they’ll receive their goods, and if they’re delayed, why.
  • Relationships matter. Shippers are looking for partners. After the last few years and the tumultuous supply chain we’ve experienced, now more than ever people are looking for good relationships and the ability to talk to someone they trust. There are a lot of questions about the future, and customers are looking for great advice on how to navigate tumultuous waters together. Many of our customers are asking how we handled the disruptions in the past and how we thought outside of the box. It’s important to be nimble and agile with a purpose to provide efficient solutions.

The Year Ahead
After TPM, rates get locked and RFP season goes into full gear. To ensure you feel confident about forecasts for the year ahead before launching your RFPs, don’t hesitate to reach out to your Flexport account managers and our teams to discuss strategies for Fixed/Floating, and BCO/NVO volume contracts.

Trends to Watch

[Air – Global] (Data Source: WorldACD/Accenture)

  • Overall Growth in Demand: The first two months of the year saw a +13% increase in worldwide air cargo demand compared to the same period last year, driven by strong performance from Middle East & South Asia (MESA) origins and recovery from the Lunar New Year (LNY) seasonal dip.
  • February’s Performance: Preliminary figures for February indicate an +8% year-on-year increase in air cargo tonnages, with a +4% increase when adjusting for the leap year day. This follows a +17% increase in January, showcasing a consistent upward trend despite the complications of comparing months due to LNY variances.
  • Post-LNY Recovery: Three weeks after the later Lunar New Year in 2024, demand had largely rebounded from the post-LNY dip, especially in the key Asia Pacific region, mirroring patterns from 2023 but with somewhat stronger demand in 2024.
  • Regional Dynamics: Strong rebounds were observed in intra-Asia Pacific traffic, up by +44% in Weeks 8 and 9 compared with Weeks 6 and 7, and significant year-on-year growth in tonnages from MESA in the same weeks (+22%), reflecting continued disruption in sea-air shipping routes due to the situation in the Red Sea.
  • Global Pricing and Capacity Trends: Despite a global average rate decline of -16% compared to last year, rates from MESA are up +13%, indicating a regional anomaly. Global air cargo capacity is up by +9% over last year, with notable increases from Asia Pacific and Central & South America, highlighting an overall growth in the air cargo industry above pre-COVID levels.
  • Average global rates remain above pre-COVID levels (+27% compared to February 2019).

[Ocean – FEWB]

  • Asia-North Europe: The Red Sea situation continuously impacts freight market developments. Some vessels continue to reroute via the Cape of Good Hope, and some carriers are investigating the situation and re-routing back via the Suez Canal. More to follow as information becomes available.
  • Demand is flat, and carriers are further adjusting rates for more fresh cargo in 2H March. Carriers are still upholding PSS/Contingency Surcharges due to rerouting vessels, however, more questions about the actual additional cost are being brought up and further adjustments are expected in April.
  • Carriers are actively investigating demand & supply. We’re seeing vessels open for booking till last minute, which may reflect the oversupply situation. If soft demand continues from Week 12 onwards, we expect there could be more blank sailings announced soon.
  • For historical updates on the Red Sea situation, read more in Global Ocean Carriers Halt Red Sea Transits – What to Expect.

North America Vessel Dwell Times


markdown image
Source from Flexport.com

Freight Market Update: March 7, 2024

Trends to Watch

[Air – Global] (Data Source: WorldACD/Accenture)

  • Global air cargo tonnages increased in the last full week of February following the typical dip during the Lunar New Year (LNY), with significant surges in tonnages at key Asia-Europe sea-air hubs (Dubai, Colombo, Bangkok) due to disruptions in container shipping in the Red Sea.
  • Dubai-Europe air cargo traffic in week 8 saw a more than double increase (+146%) compared to the same period last year, with recent weeks showing a +140% year-on-year (YoY) rise. Colombo-Europe and Bangkok-Europe also experienced significant YoY tonnage increases, indicating strong demand for air cargo as an alternative to disrupted sea routes.
  • The sustained high demand for air cargo through these hubs into March is uncertain, but week 8 showed no signs of waning, contributing to a +9% week-on-week rise in global air cargo tonnages, partially recovering from previous drops during LNY.
  • A broader two week comparison highlights the impact of LNY and Valentine’s Day on demand, with significant tonnage decreases from Asia Pacific and Central & South America, but a notable rise from the Middle East & South Asia region. Global average prices fell by -6% due to these fluctuations, despite a price rise from the Middle East & South Asia.
  • Year-on-year data reveals a -4% decrease in worldwide tonnages for weeks 7 and 8, with a significant drop ex-Asia Pacific but a notable increase ex-Middle East & South Asia. Average global rates remain above pre-COVID levels, though they have decreased compared to the previous year, with worldwide air cargo capacity significantly up (+8%).

[Ocean – FEWB]

  • The Red Sea Crisis is continuously impacting freight market development. With most of the vessels routed via the Cape of Good Hope, carriers believe the supply will still be balanced with demand in a mid-run. The Lunar New Year (LNY) soft demand is temporary, however, equipment is in better shape (mainly because of LNY slow recovery). Carriers are also investigating the situation and re-routing back via the Suez Canal. More details to follow as information is made available.
  • Demand remains flat post LNY. Carriers are further adjusting rates to cater fresh cargo in 1H March. PSS/Contingency Surcharges are still being upheld by carriers due to the reroute, however, more questions about the actual additional cost are being brought up and we expect there will be adjustments in March.
  • Ocean Alliance continuously announced voided plans for March. With 2M’s Winter Program ending, carriers are actively investigating the demand & supply. If soft demand continues from Week 12 onwards, we expect there may be more blank sailings announced.
  • To mitigate the disruption of operational challenges (sailing schedule adjustments, vessel downsizes, equipment shortages, rollover, etc.), shippers can consider premium services offered by liners with higher costs. This approach will help guarantee space and equipment and shorten delays.

North America Vessel Dwell Times


markdown image

New! Flexport Ocean Timeliness Indicator

Ocean Timeliness Indicators for China to Northern Europe Increase While China to U.S. East/West Coast Stabilize

Welcome to the new Ocean Timeliness Indicator! Due to ongoing global shipping events in the Panama and Suez Canal, we have refined our previous report by splitting the Transpacific Eastbound trade lane into two subtradelanes: TPEB to the U.S. West Coast, and TPEB to the U.S. East Coast.

The Methodology: The Flexport Ocean Timeliness Indicator (OTI) utilizes data from Flexport’s ocean shipping operations for an expansive view of the cargo’s journey. Updated on a weekly basis, the Flexport OTI shows the transit time from the cargo ready date at the exporters’ factory or warehouse to the containers’ departure from the destination ocean port. The ocean shipping world tends to run along “trade lanes.” The three biggest east-west trade lanes carry goods from Asia to the U.S. West Coast, Asia to the U.S. East Coast, and from Asia to Northern Europe. The OTI captures the timeliness of each. As there are many transit time nuances from port to port and service to service, to show accurate trends, the OTI uses the following logic:
– Excludes premium services
– Displayed transit times are based on a trailing two-week median
– Major origin and destination ports are used as a proxy for the overall trade lane to create clear trends. Other origin or destination ports will have additional transit time considerations based on ocean carrier services.
*- Asia to U.S. West Coast trade lane uses the China ports of Shanghai and Ningbo and the U.S. West Coast ports of Los Angeles/Long Beach.
– Asia to U.S. East Coast trade lane uses the China ports of Shanghai and Ningbo and the U.S. East Coast ports of New York/New Jersey and Norfolk.
– Asia to North Europe trade lane uses the China ports of Shanghai and Ningbo and the North Europe port of Rotterdam.

Week to March 4, 2024

This week, the OTI for China to Northern Europe increased to 63 days due to carrier re-routings from the Suez Canal to the Cape of Good Hope. These transit times have begun to normalize but will change when carriers decide to transit the Red Sea again. The OTI for China to the U.S. East Coast remains elevated at 59 days as some carriers route westward around Cape of Good Hope while most leverage the Panama Canal despite slot restrictions. The OTI for China to the U.S. West Coast remains at 37 days as the transit time impact from the Red Sea situation is minimal.


markdown image


Please direct questions about the Flexport OTI to press@flexport.com.

See full report here.

The contents of this report are made available for informational purposes only. Flexport does not guarantee, represent, or warrant any of the contents of this report because they are based on our current beliefs, expectations, and assumptions, about which there can be no assurance due to various anticipated and unanticipated events that may occur. Neither Flexport nor its advisors or affiliates shall be liable for any losses that arise in any way due to the reliance on the contents contained in this report.

Source from Flexport.com

Freight Market Update: February 29, 2024

Trends to Watch

[Air – Global] (Data Source: WorldACD/Accenture)

  • Strong Surge in Tonnages at Asia-Europe Sea-Air Hubs: Recent weeks have seen a notable increase in air cargo volumes at key Asia-Europe sea-air hubs such as Dubai, Colombo, and Bangkok, driven by shippers seeking alternatives to container shipping disruptions due to attacks on ships in the Red Sea. This surge is attributed to the need to replenish European stocks affected by longer container ship voyages around the Cape of Good Hope.
  • Significant Year-on-Year Growth: Analysis highlights a year-on-year increase in air cargo tonnages to Europe from Dubai (+71%), Colombo (+61%), and Bangkok (+58%) in the first seven weeks of 2024, significantly outpacing growth at other hubs like Singapore and Doha.
  • Impact of Lunar New Year Timing: The later occurrence of Lunar New Year (LNY) in 2024 complicates week-by-week comparisons but underscores a clear pattern of increased tonnages from these hubs to Europe. Despite this, the impact on pricing remains uncertain due to various factors, including market-wide declines from the previous year.
  • Seasonal Demand Fluctuations: Post-LNY, a traditional decline in demand from Asia Pacific is observed, affecting global air cargo tonnages and rates. However, there’s a structural improvement in demand compared to the previous year, with specific regions like the Middle East & South Asia experiencing tonnage and rate increases, likely reflecting the shift from ocean freight to sea-air solutions.
  • Global Air Cargo Trends: Overall, despite a slight year-on-year decrease in worldwide tonnages for weeks 6 and 7, structural improvements in demand levels are evident. Notably, worldwide air cargo capacity has increased, with significant rises from Asia Pacific and Middle East & South Asia, indicating a robust recovery and adaptation within the air cargo industry to ongoing logistical challenges.

[Ocean – ISC to North America]

  • Rates: Reduced down after the 2H February GRI. Carriers had initially posted a March 1st GRI of $1000/container, but as of this week have postponed it until 2H March. Without any changes to the market it is likely the GRI will be canceled entirely.
  • Space: Vessels delayed getting to destination and back to origin are resulting in a lack of capacity. The short term disruption is expected to be more challenging, while longer term we expect some normalization due to new builds, faster vessel speeds, and implementation of idle capacity.
  • Equipment: Although equipment availability is carrier-specific for each port of loading, the overall situation is challenging. This is especially true at inland container depots and smaller/less connected ports.

[Ocean – FEWB]

  • Red Sea: This remains unresolved as most vessels continue to reroute via the Cape of Good Hope, adding 2-4 weeks of transit time (round trip). Vessel schedules will continue to fluctuate as a result, and regional equipment shortages will occur in some Asian ports.
  • Demand: Demand has softened as expected after the LNY holiday. Bookings have slowed down in week 9; we expect them to pick up from week 11 onwards. As roll pools have been created in the past few weeks, vessel utilization is positive at the moment, and carriers are continuing to assess capacity and rates.
  • Capacity: All alliances implemented massive blank sailings pre-LNY for weeks 8 and 9, which cut about 30+% of capacity on average. After the LNY holiday, Ocean Alliance announced two more void plans for March. If demand remains flat, there might be more blank sailings to be announced. Occasional space constraints due to smaller vessel deployment and schedule re-shuffling due to current re-routing will also impact the available capacity each week.
  • Rate Development: As the Red Sea situation continues to impact capacity and equipment, carriers are upholding rates via GRI / PSS / Contingency Charges, however there’s pressure and questions about the amount of additional costs of re-routing via Cape of Good Hope. Expectations are that the Peak Season quantums will be mitigated or even be dropped in March. Rates are expected to go down as of March 1 and continue to decline going forward due to low demand.

Please reach out to your account representative for details on any impacts to your shipments.

North America Vessel Dwell Times


markdown image

New! Flexport Ocean Timeliness Indicator

Due to ongoing global shipping events in the Panama and Suez Canal, we have refined our previous report by splitting the Transpacific Eastbound trade lane into two subtradelanes: TPEB to the U.S. West Coast, and TPEB to the U.S. East Coast.

Ocean Timeliness Indicators for China to Northern Europe and China to U.S. East/West Coast Stabilize

Week to February 26, 2024

This week, the OTI from China to Northern Europe due to the Suez Canal Crisis remains high above 60 days. We anticipate these transit times have begun to normalize at these new highs as vessels sail around the Cape of Good Hope. The OTI for the China to U.S. East Coast remains steady at 59 days as does the OTI for China to the U.S. West Coast at 37 days.


markdown image


The Methodology: The Flexport Ocean Timeliness Indicator (OTI) utilizes data from Flexport’s ocean shipping operations for an expansive view of a container’s journey. Updated on a weekly basis, the Flexport OTI shows the time taken to transit from the Cargo Ready Date at the exporters’ gate to the Destination Port Departure date when products are ready to leave port to go to importers. The ocean shipping world tends to run along “trade lanes.” The three biggest trade lanes carry goods from China to the U.S. West Coast of North America, China to the U.S. East Coast of North America, and from China to Northern Europe. The OTI captures the timeliness of each of these. To show the most realistic picture, the OTI will exclude premium services and will utilize a trailing two-week approach.

See full report here.

The contents of this report are made available for informational purposes only. Flexport does not guarantee, represent, or warrant any of the contents of this report because they are based on our current beliefs, expectations, and assumptions, about which there can be no assurance due to various anticipated and unanticipated events that may occur. Neither Flexport nor its advisors or affiliates shall be liable for any losses that arise in any way due to the reliance on the contents contained in this report.
Freight Market Update: February 22, 2024

Trends to Watch

[Air – Global] (Data Source: WorldACD/Accenture)

  • China’s Inbound Tonnage Decline: In the week leading up to the Lunar New Year, China experienced a significant drop in inbound air cargo tonnages by 15% week-over-week, contributing to a global tonnage fall of 12%. This was against a backdrop of only a 2% decline in China’s outbound tonnages, indicating a sharp contrast in trade dynamics as the holiday approached.
  • Stable to Rising Average Global Rates: Despite the drop in tonnages, average global air cargo rates remained steady and even saw a slight increase during week 6, mirroring trends from the previous year. This suggests resilience in pricing amid fluctuating volumes.
  • Intra-Asia Pacific Market Slowdown: A notable 17% fall in intra-Asia Pacific traffic largely drove a 3% global tonnage decline, highlighting the region’s quick response to the Lunar New Year compared to long-haul markets. Conversely, tonnages from Asia Pacific to certain regions like Central & South America increased, demonstrating varied market reactions.
  • Year-on-Year Tonnage and Capacity Increase: Comparatively, weeks 5 and 6 saw a 10% increase in worldwide tonnages year-on-year, with significant rises from Asia Pacific and Middle East & South Asia origins. This was accompanied by a substantial 16% increase in global air cargo capacity, indicating an overall growth in the air cargo sector from last year.
    Pricing Trends and Pre-Covid Comparison: Despite a year-on-year drop in average worldwide rates by 14%, the gap is narrowing, and rates remain significantly above pre-Covid levels (34% increase compared to February 2019), suggesting a sustained recovery and adaptation in the air cargo market post-pandemic.

[Ocean – ISC to North America]

  • Rates: Increased due to 2H February General Rate Increases (GRIs), but as of week 8 are starting to mitigate. Overall levels still remain significantly inflated compared to November levels at +250% to United States East Coast (USEC) BP and +90% to United States West Coast (USWC) BP.
  • Space: Vessels delayed in getting to destination and back to origin are resulting in a lack of capacity. The short-term disruption is expected to be more challenging, while longer term we expect some normalization due to new builds, faster vessel speeds, and implementation of idle capacity.
  • Equipment: Although equipment availability is carrier-specific for each port of loading, the overall situation is challenging. This is especially true at inland container depots and smaller/less connected ports.

Please reach out to your account representative for details on any impacts to your shipments.

North America Vessel Dwell Times


markdown image

This Week In News

Cargo Diversions To West Coast Have Started, LA Port Director Confirms
Shippers are rerouting their cargo to the West Coast of the United States, particularly to the Port of Los Angeles, to avoid security concerns in the Red Sea and drought-related issues at the Panama Canal. Despite not experiencing a surge in freight, the port has observed an increase in cargo volumes, with January marking the second busiest month on record. Retailers are actively replenishing inventories ahead of Lunar New Year closures, and positive economic indicators suggest continued spending by American households.

Import Demand Growth Robust Leading Into Lunar New Year
Bookings for freight bound for the top four U.S. port complexes had surged compared to last year in the lead-up to the Chinese New Year, particularly from China, prompting a notable shift in the supply chain. This spike in orders signifies a departure from the minimal increase seen last year due to pandemic-related inventory surpluses. The rise in demand, especially in Southern California ports, may be influenced by geopolitical conflicts and disruptions like the Red Sea conflict and drought in Panama. Importers are willing to pay higher rates to ensure timely delivery of goods, indicating potential spring demand.

Freight Shipments And Expenditures See January Declines, Notes Cass Freight Index

The January edition of the Cass Freight Index reveals sequential and annual declines in freight shipments and expenditures. Shipments fell 7.6% annually, continuing a trend from previous months, while expenditures dropped 24.3% annually, following a record surge in 2021 and subsequent increases in 2022. Despite harsh winter weather, the decline in shipments aligns with normal seasonality, indicating a potential improvement in freight trends. ACT Research suggests that with destocking and rising goods consumption, the freight downturn may be nearing its end, anticipating improved freight demand fundamentals in 2024.

Rising Inflation Driving Food Supply Chain Robberies
Food theft in the global supply chain has surged, now comprising a third of all hijacking incidents, with a 29% increase in 2023 compared to 2022 levels, according to the British Standards Institution (BSI). This rise is attributed to thieves targeting basic goods experiencing significant price hikes due to inflation. Notably, food and beverage items now represent 22% of overall theft, with agricultural products accounting for 10%. While thefts from facilities have decreased, thefts from containers or trailers have risen sharply. Lack of secure truck parking is cited as a major factor, with road haulage sectors in Europe being particularly vulnerable.

Source from Flexport.com

Freight Market Update: February 14, 2024

Trends to Watch

[Ocean – TAWB]

  • Various rate indices are starting to show levels jumping by around $500 per TEU as of Feb. 1. This was expected due to carriers introducing surcharges related to the Red Sea situation (Contingency Surcharges, Emergency Surcharges, PSS, etc.).
  • Rates are expected to increase further in March due to equipment becoming limited in most parts of Europe (mainly south of Germany, Poland, and Western Mediterranean areas).
  • Capacity remains relatively stable even though we have seen blank sailings and vessels redeployed on other trade lanes in order to help with the Red Sea situation.
  • Panama Canal drought issues had minimal impact on container vessels transiting in January year-over-year.

[U.S. Exports]

  • Inland rail yards and export loading points are dealing with increasingly spotty equipment (EQ) levels. Please place bookings four weeks in advance of Cargo Ready Date (CRD). If that’s not achievable, consider loading trucks and transload at a coastal port to avoid ongoing EQ concerns.
  • For shipments loading at a coastal port, please book an additional 2-3 weeks or more ahead of CRD to ensure loading is optimized to avoid blank sailings and ensure equipment is available in a timely manner.
  • For Transatlantic Eastbound, capacity is available from base port to base port.

[Air – Global](Data Source: WorldACD/Accenture)

  • Increased Rates from China: Air cargo rates from China to North America and Europe surged by more than 14% and more than 8%, respectively, in the week before Lunar New Year, although still below early December peaks.
  • Impact of Red Sea Disruptions: Disruptions in container shipping in the Red Sea may have contributed to the rate surge, prompting some sea freight from China to Europe to convert to sea-air shipments.
  • Strong Traffic Demand: There is strong ongoing air cargo demand from China to both Europe and North America, despite current disruptions and the seasonal impact of the Lunar New Year.
  • Rising Global Demand and Rates: Global air cargo demand and rates have continued to rise due to Lunar New Year, with significant year-on-year tonnage increases supported by strong ecommerce traffic.
  • Substantial Yearly Increases: Worldwide tonnages saw a more than 25% increase in weeks 4 and 5 compared to the previous year, with significant rises from Asia Pacific, the Middle East, and South Asia, partly due to the conversion of sea freight to sea-air shipments.
  • Rates trend at over 32% compared to Feb 2019.

[LATAM North Bound]

  • The Port of Navegantes in Brazil is undergoing civil works to adapt pier infrastructure for the upcoming two years, which started on Jan. 5, 2024. This will be done in two phases. While one side will be under construction, the other will continue to operate normally. The work will begin on the east side, and when this stage is completed, it will move to the west side.
  • While the port is currently operating without restrictions, we will likely see operational challenges and higher wait times for all services through Navegantes during this period. Some shippers may choose to switch to nearby ports (Itapoá and Paranaguá).
  • CMA announced they will be switching to Imbituba on their BRASEX service. MSC, on the other hand, is committed to serving customers ex Navegantes. MSC has two main services from Brazil and will optimize these services to service USEC, USGC, and USWC/ CA.

Please reach out to your account representative for details on any impacts to your shipments.

North America Vessel Dwell Times


markdown image

This Week In News

Major Delays In Cross-Border Cargo Flow After Glitch In Mexican Customs System
A series of persistent glitches in Mexico’s National Customs Agency (ANAM) computer system severely disrupted freight movements across the U.S. border and caused delays at ports and airports. The glitches, occurring over several days, affected the agency’s ability to process import and export documents electronically, prompting ANAM to operate in “contingency” mode.

Upcoming Indo-Pacific Trade Deal Adds To U.S. Supply Chain Priorities
The Indo-Pacific Economic Framework for Prosperity (IPEF) supply chain agreement is set to go into effect on Feb. 24, to strengthen supply chain resilience among Pacific Ocean trading countries. Signed by partner countries such as the U.S., Australia, and Japan, the agreement emphasizes data sharing, warehousing near ports, and collaboration on policy best practices to build resilient and inclusive supply chains.

Despite Dim Outlook, January Imports Grew At Fastest Pace In 7 Years
Despite geopolitical tensions and challenges at the Suez and Panama Canals, U.S. imports surged unexpectedly in January, rising 7.9% from December and 9.9% year-over-year, according to Descartes. This growth, driven by a rush of Chinese imports ahead of the Lunar New Year, saw West Coast ports benefiting the most, with Long Beach and Los Angeles experiencing significant increases.


Source from Flexport.com

Freight Market Update: February 7, 2024

Trends to Watch

[Air – Global](Data Source: World ACD/Accenture)

  • From January 1-28, 2024, global international air cargo capacity increased by 10% compared to 2019.
  • Over the last four weeks, global international air cargo capacity decreased by 4% compared to the four weeks prior.
  • Air cargo capacity out of China and Hong Kong around Lunar New Year is expected to drop by 30-40% this year, in line with previous years.
  • Yields for Transpacific and Asia-Europe routes have increased in the last weeks of January due to the Red Sea crisis and the anticipation of the Lunar New Year, even though average yields for January 2024 remain lower than those of January 2023.
  • A consistent rise in air freight volumes has been observed over recent months, significantly fueled by strong e-commerce activity originating from the Asia Pacific region since the last quarter of the previous year, alongside a noticeable shift of some goods from sea freight to air and combined sea-air transport, attributed to recent disturbances in container shipping operations in the Red Sea.

[U.S. Exports]

  • Inland rail yards and export loading points are seeing less, or increasingly spotty, equipment levels. Customers are advised to place bookings 3-4 weeks in advance of cargo ready date (CRD). If that’s not achievable, consider truck and transload to load at a coastal port to avoid ongoing equipment concerns.

[Ocean – FEWB]

  • Asia-North Europe: the Red Sea crisis continues to impact freight market development. CMA CGM suspended Red Sea transits again until further notice due to security risks.
  • With vessel delays back to Asia, equipment is getting tight prior to Lunar New Year departures. Most carriers are arranging container repositioning to get shipments moved as planned. We highly recommend shippers be flexible and accept container substitution to avoid further delay as well as arrange empty pick-up as early as possible. Carriers are offering extended origin free time to mitigate Lunar New Year impact.
  • Demand is expected to remain flat for the second half of February. Carriers are further adjusting rates down to cater fresh cargo from the first half of February, preparing for rollpool to fill second half of February vessels. Even though massive void plans have been announced (WK08/09 cut by 30% in average), Ocean Alliance announced seven more voids, with three planned for February departure and the rest in March. We foresee more void plans will be released soon by the other two alliances.
  • To mitigate the disruption of operational challenges (sailing schedule adjustment, vessel downsized, equipment shortages, rollover, etc.), shippers can explore premium services offered by liners with higher cost to get guaranteed space and equipment and to shorten delays.
  • Asia-Med: Following North Europe, MED floating rates remained on the higher side. They are trending slightly lower from Week 06 onwards in a push to get more cargo to fill up ships before Lunar New Year and also rollpool preparation for 2H February onwards due to the weak demand and holidays in Asia.

Please reach out to your account representative for details on any impacts to your shipments.

North America Vessel Dwell Times


markdown image

This Week In News

Q4 U.S. Bank Freight Payment Index Shows Annual Freight Shipment And Spending Declines
The U.S. Bank Freight Payment Index for the fourth quarter revealed declines in freight payments and expenditures, with the shipment index down 10.9% from the third quarter and 15.7% annually, marking the largest decline since the index’s inception in 2017. Regionally, the Southeast, Northeast, and West experienced the steepest annual shipment declines.

Port Of Virginia Cargo Volumes Dip 2% In December
In December, container volumes at the Port of Virginia declined by 2% year-over-year to 268,107 total TEUs, marking the eleventh consecutive month of decreasing cargo volumes at the port. Despite the recent dip, container volumes were 19% higher compared to pre-pandemic levels, indicating long-term improvement despite the lull experienced in 2023.

Retailers Are Planning To Shake Things Up In 2024, Survey Finds
A new survey from Carl Marks Advisors reveals that mid-market retail and consumer packaged goods companies are planning changes to their supply chain strategies. The survey involved 250 responses from executives at mid-market retail and CPG companies with annual revenues between $25 million and $300 million.


Source from Flexport.com

Freight Market Update: February 1, 2024

Trends to Watch

[Air – Global](Data Source: WorldACD)

  • January’s worldwide air cargo demand showed a significant increase compared to last year. This rise in demand was seen across all main global regions except for ex-North America traffic.
  • Due to disruptions in the Red Sea, some cargo owners are moving Asia-Europe cargo from sea to air or sea-air (e.g. air to ocean conversions). This shift, combined with the effects of the later Lunar New Year in 2024 (February 10) and typical mid-January seasonal trends, contribute to the increase in air cargo demand.
  • Despite major disruptions in international container shipping and a tripling of ocean freight spot rates from Asia to Europe, global air cargo rates remain relatively stable. However, ex-Asia Pacific air cargo rates had already risen in late 2023 due to seasonal and product-related demand factors.
  • Forwarders are preparing for challenges in the next few weeks, including port delays and cargo build-up in Europe, as the booking window for air freight is closing ahead of the Lunar New Year. This situation may lead to increased reliance on air cargo.
  • Comparing weeks 2 and 3 of 2024 with the same period last year, there’s a 6% increase in overall global demand, with notable increases from the Middle East and South Asia, Africa, and Asia Pacific. Average worldwide rates are 22% lower than last year but remain above pre-COVID levels. Air cargo capacity has also seen a significant year-over-year increase.

[Indian Subcontinent to North America – Ocean]

  • Ocean freight rates continue to increase into the first half of February as Red Sea disruptions show no sign of mitigation. Vessels that were delayed getting to their destination, and then back to origin, due to diversions around the Cape of Good Hope have created capacity shortages. This short-term disruption is expected to be more challenging, while we expect some normalization in the longer term.
  • Container deficits are carrier-specific, but recently there has been an increase in equipment issues being reported across many major wet ports and inland container depots.
  • There are several service updates to report, including MSC’s removals of INDUSA (India → USEC) service which is resulting in a capacity crunch on their remaining INDUS EXPRESS service. MSC has also removed the direct Karachi, Pakistan port call which had just been rolled out in late December. OOCL/COSCO removed AWES/ISE service (Mundra → BOS/NY/ORF) due to operational cost increases from Cape of Good Hope diversions. By removing this service there is no longer a direct connection from India to Boston.

[TAWB – Ocean]

  • Demand remains stable with no peak expected to occur in February. Carriers are still managing capacity based on the latest Red Sea developments. We expect capacity to be down by an average of 15-20%.
  • Rates are expected to increase in February as several Red Sea-related surcharges go into effect on February 1. Indexes are expected to show the same in the next couple of weeks.
  • The equipment situation in Europe is tightening (mainly in Germany and various locations in Eastern Europe). This is a direct consequence of transit time increases caused by the Red Sea situation.
  • On-time performance decreased from 72% in July 2023 to 50% in December 2023 (based on Sea Intelligence data). This is quite normal during winter months as it is mainly caused by weather-related issues.

[FEWB – Ocean]

  • The Red Sea crisis continues to impact freight market development. Vessels traveling back to Asia continue to face delays. Moreover, carriers have started announcing a lack of equipment availability ports ex-South China and some outports in Asia. Shippers should remain flexible and accept container substitutions to avoid further delays. Demand remains flat for the second half of February as the Lunar New Year approaches. As a result, carriers are adjusting rates to cater to fresh cargo from the first half of February and to prepare for roll pool to fill vessels in the second half of February, despite massive void plans (weeks 8 and 9 are expected to see a 30% decrease on average). To mitigate the disruption of operational challenges (sailing schedule adjustments, vessel downsizes, equipment shortages, rollover, etc.), shippers should explore premium services offered by liners with higher costs. This approach will help guarantee space and equipment and shorten delays.
  • In other news, although the German rail strikes ended on January 29, there’s now a protest by German farmers blocking access to key ports which is impacting road transportation and imports/exports.
  • Following North Europe, MED floating rates remain on the higher side despite trending slightly lower from week 6 onwards to fill up ships before the Lunar New Year. Additionally, roll pool preparation is now expected to take place in the second half of February onwards due to weak demand and holidays in Asia.

North America Vessel Dwell Times

markdown image

This Week In News

Congested Ports Choking the Supply Chain
In January 2024, the ports of Los Angeles and Long Beach faced increased congestion, threatening the U.S. economy. The ITS Logistics U.S. Port/Rail Ramp Freight Index reveals a surge in trans-Pacific volumes due to restocking for the Lunar New Year, combined with rerouted shipments avoiding the Suez Canal crisis.

Not All Shipowners Able to Trade EUAs, Despite EU ETS Already in Effect
The implementation of the EU Emission Trading System (ETS) this month poses challenges for shipowners, with many not yet prepared for the new emission regulations. Shipowners under the EU ETS are required to pay for EU allowances (EUAs) corresponding to their ships’ carbon emissions at EU ports, underscoring the need for emissions data verification to ensure the accuracy of annual reporting.

FTR Shippers Conditions Index Hits Highest Level Since June
The Shippers Conditions Index (SCI), an indicator reflecting market influences on the transport environment for shippers, reached a solid reading of 6.3 for November, according to freight transportation consultancy FTR. The SCI, which considers readings above zero as favorable for shippers, showed the most favorable market conditions since June 2023, driven by a decrease in diesel prices.

Source from Flexport.com